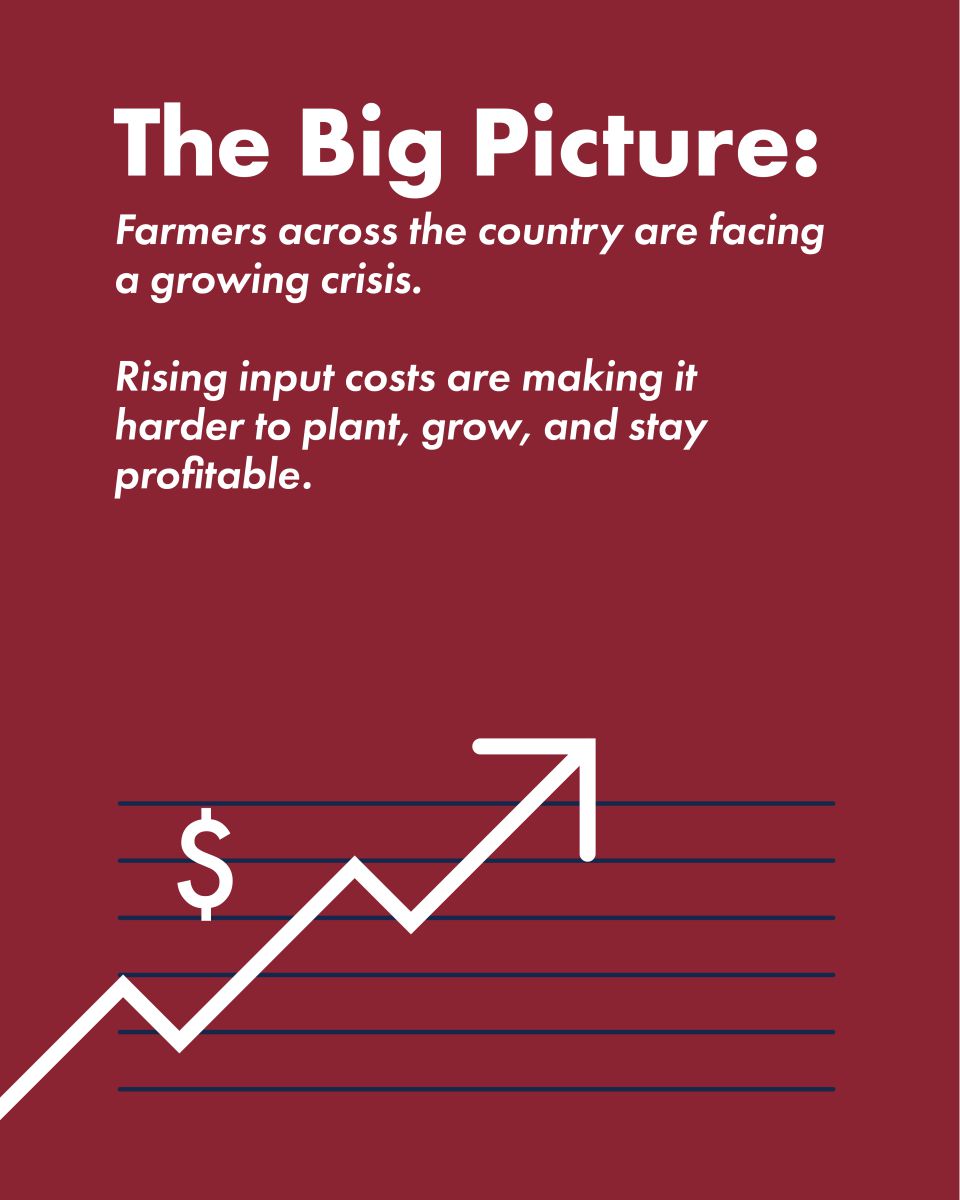
Farmers across Georgia are nearing a breaking point as the demands of modern agriculture grow heavier by the year. The cost of everything—from equipment and fuel to fertilizer and land—continues to climb, while new regulations add layers of complexity and compliance burdens to already full days. While technology is essential, it requires major investments just to keep up, and the financial risks tied to unpredictable markets and extreme weather make every season feel like a gamble. Despite all of this, profit margins remain razor-thin.
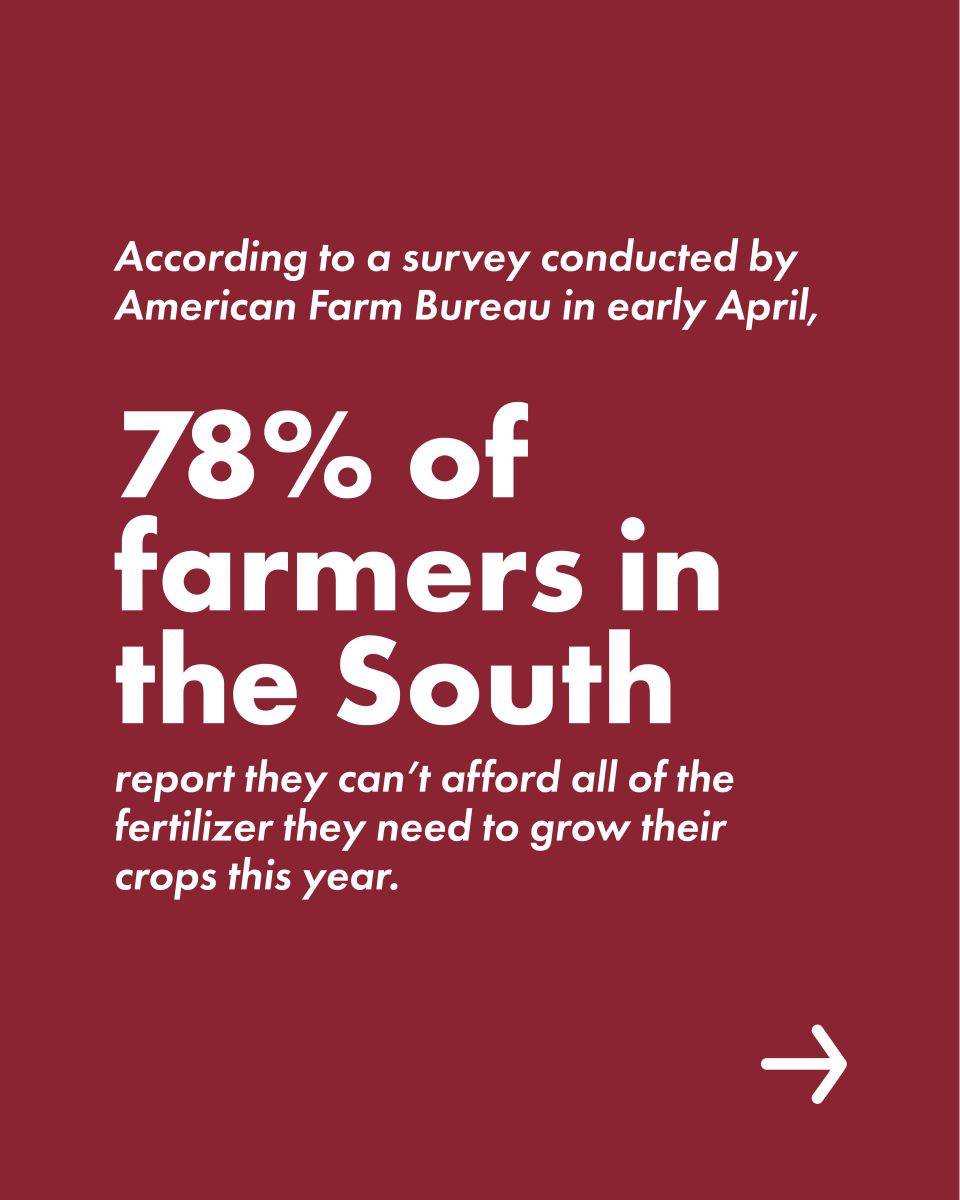
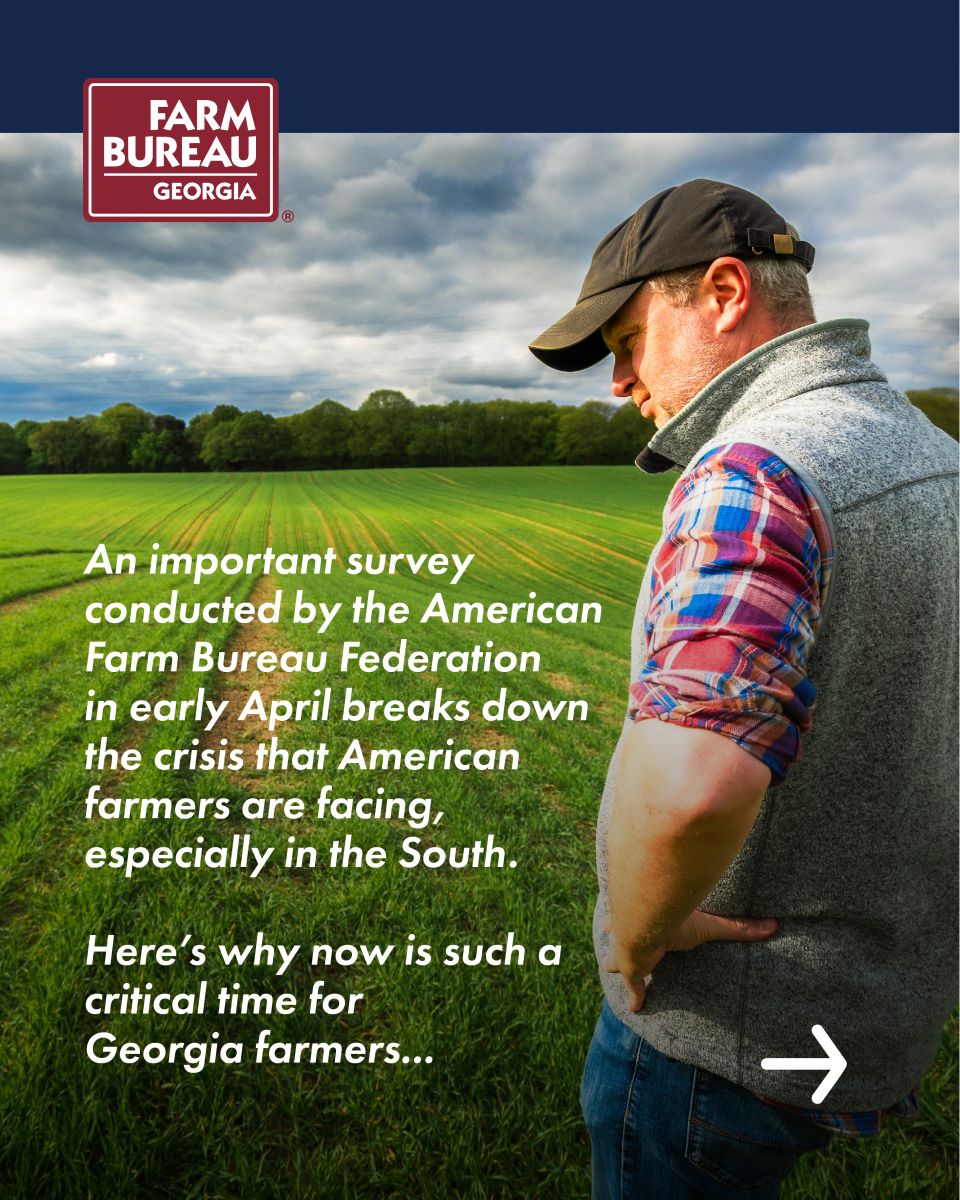
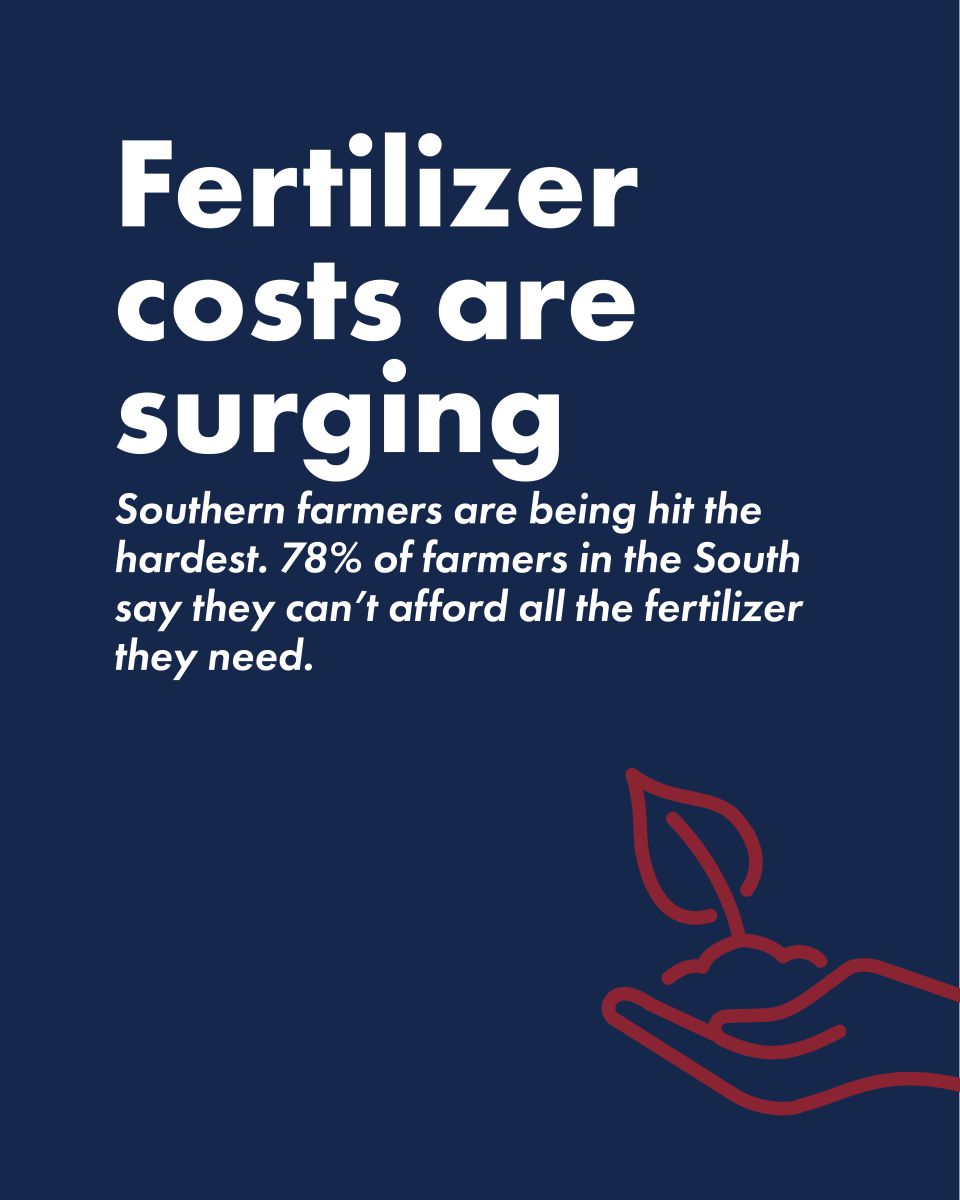
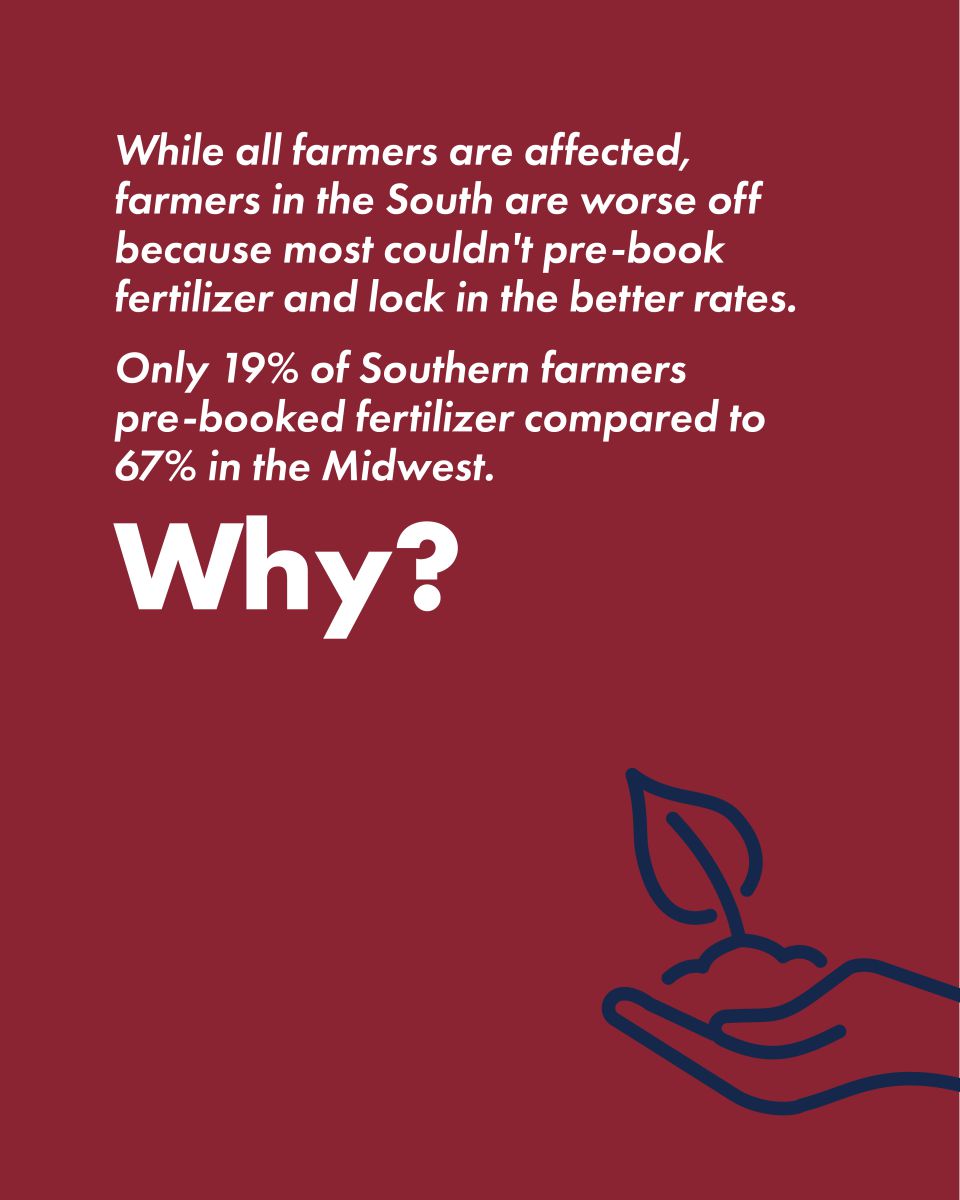
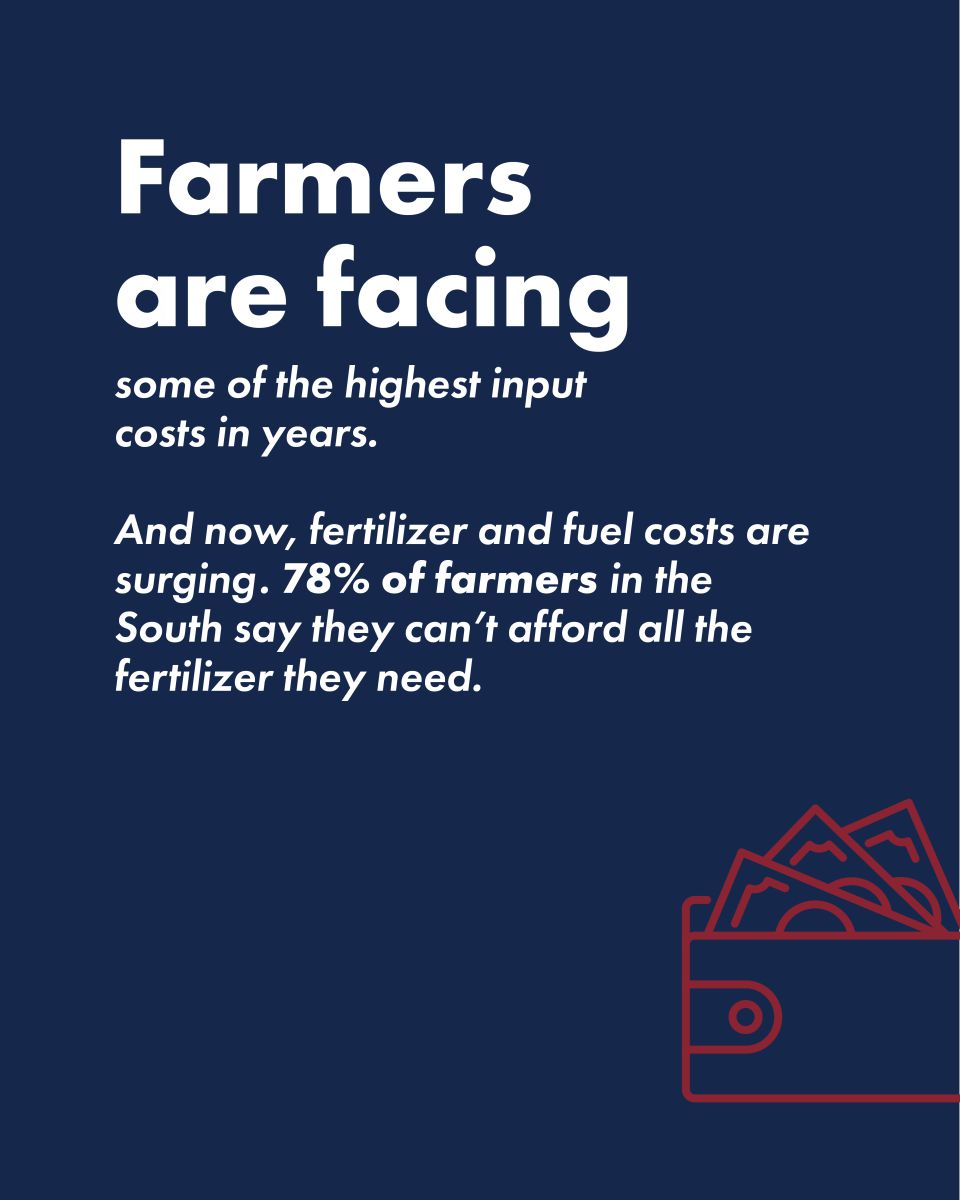
A new survey from American Farm Bureau completed in early April shows that 78% of farmers in the South can't afford the fertilizer they need right now, which is setting off a chain reaction that will have a signficant impact on all Americans.
Farmers are being asked to produce more, navigate more, and withstand more—yet they’re earning less. It’s a level of pressure that’s simply unsustainable for the people who feed, fuel, and clothe our communities.
We need your help.
Help us educate consumers and our elected leaders and consumers by sharing the facts.
Find resources and downloadable graphics to help spread the word.
Learn more about the immense challenges modern farmers must overcome.
We're looking for farmers willing to share their story with media. If you're interested, please reach out!
If you're a member of the media who would like to cover this story, we can connect you with a farmer.
AFBF survey shows Southern farmers hit hard by rising fuel & fertilizer costs
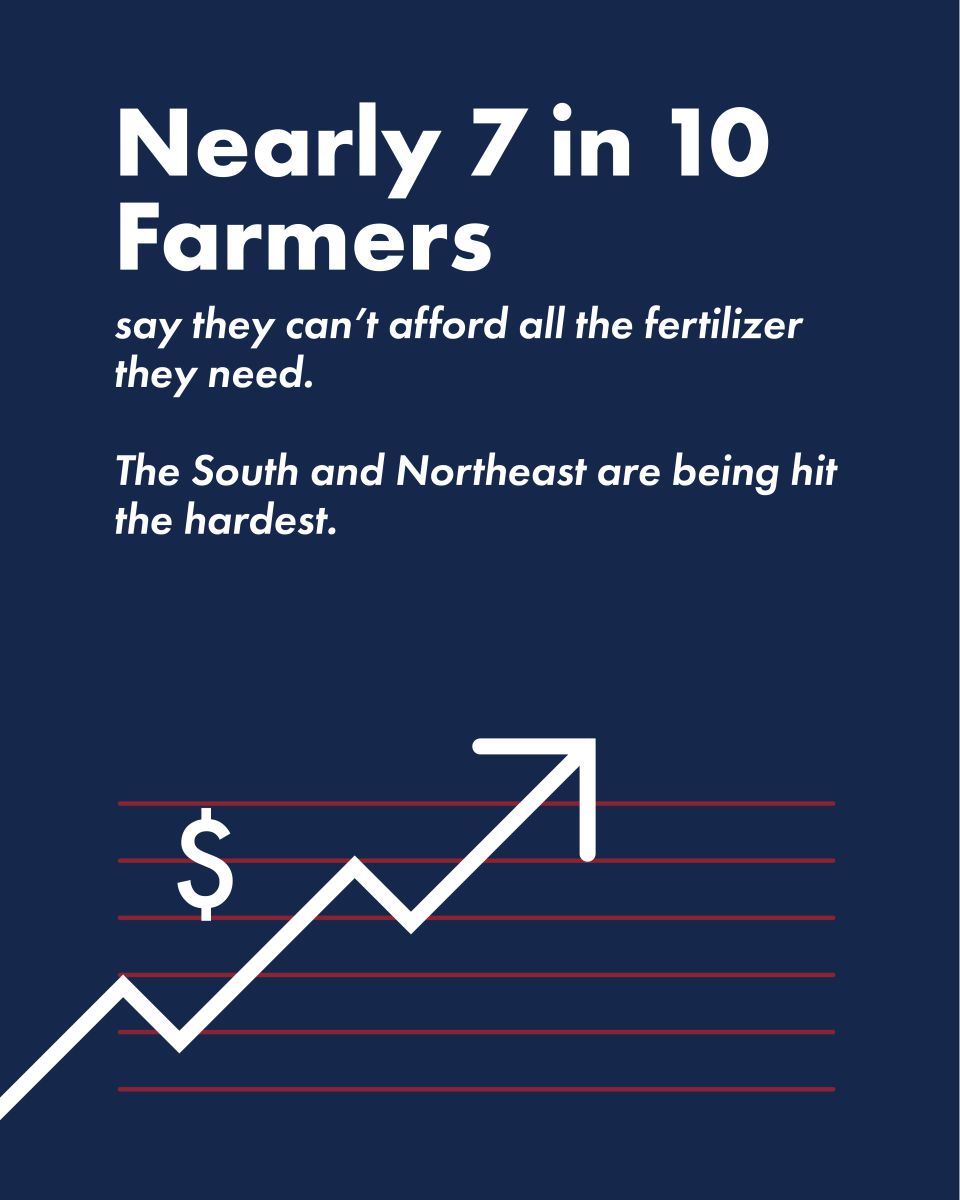
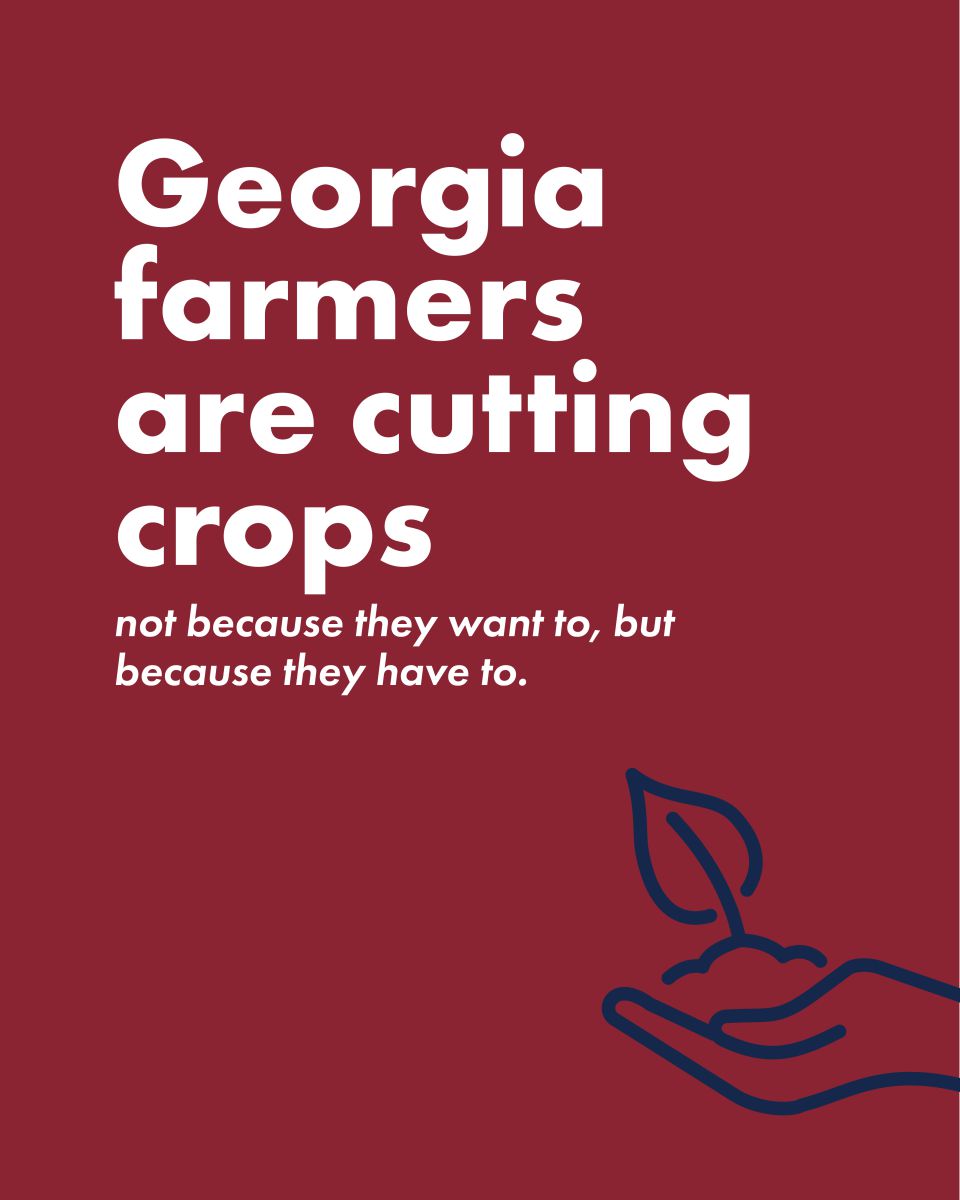
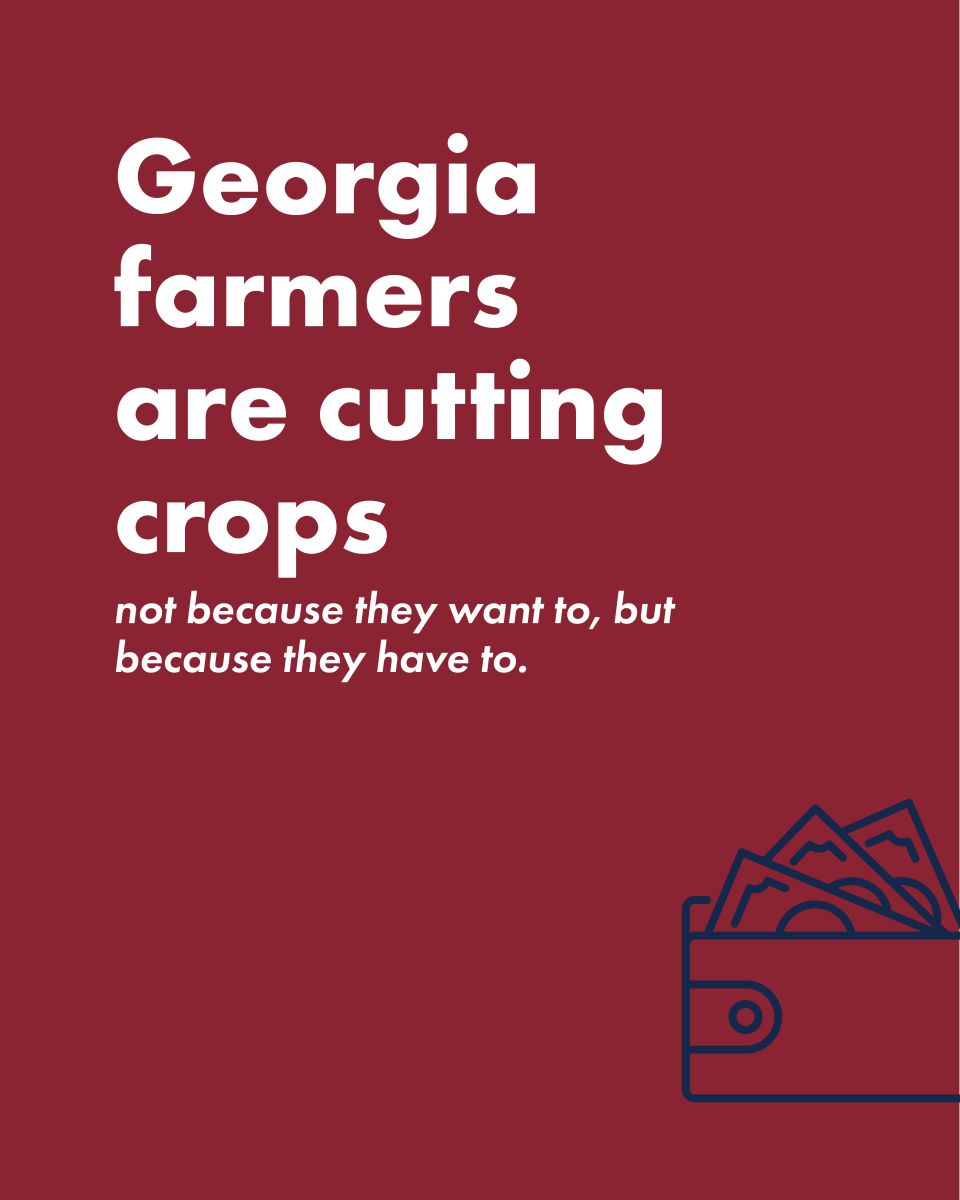
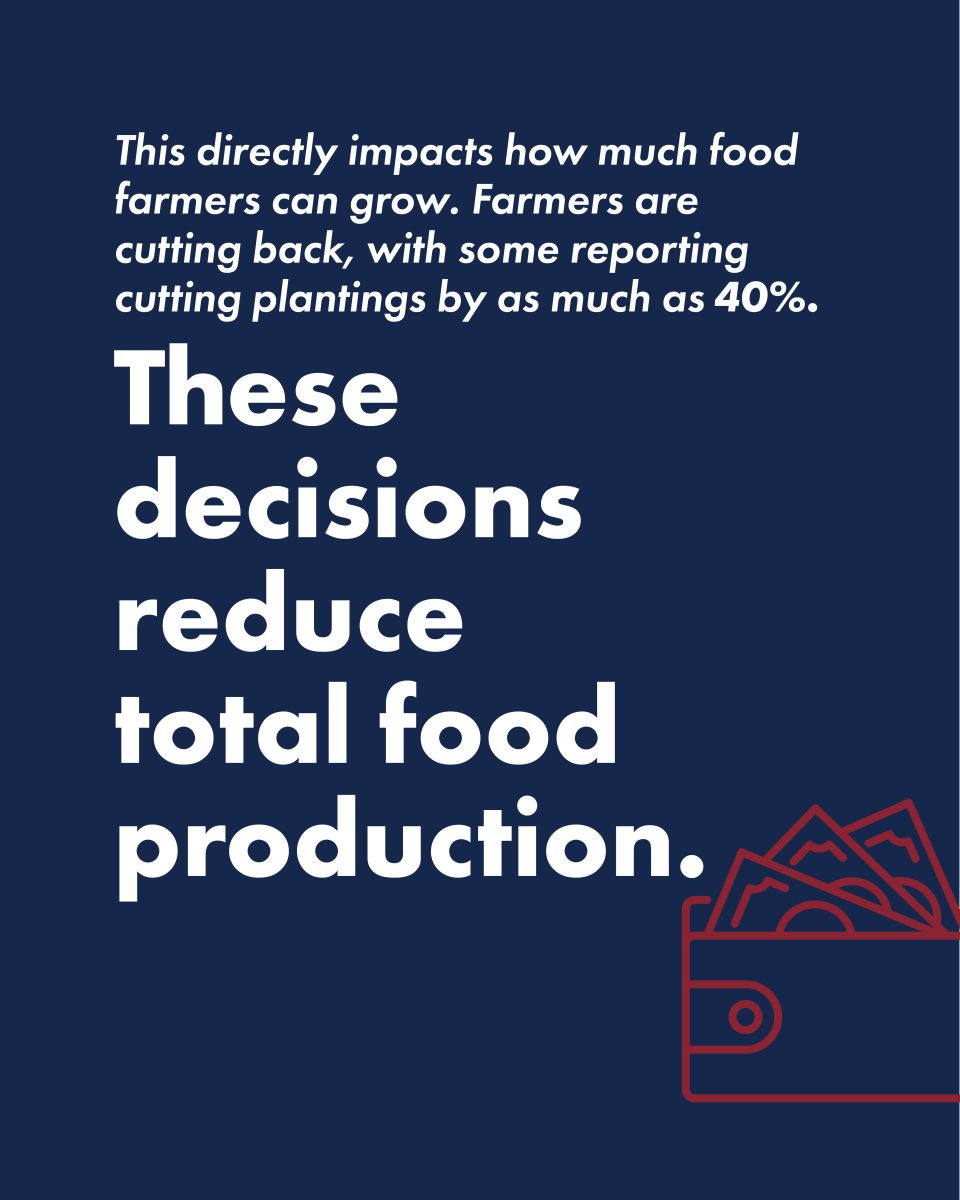
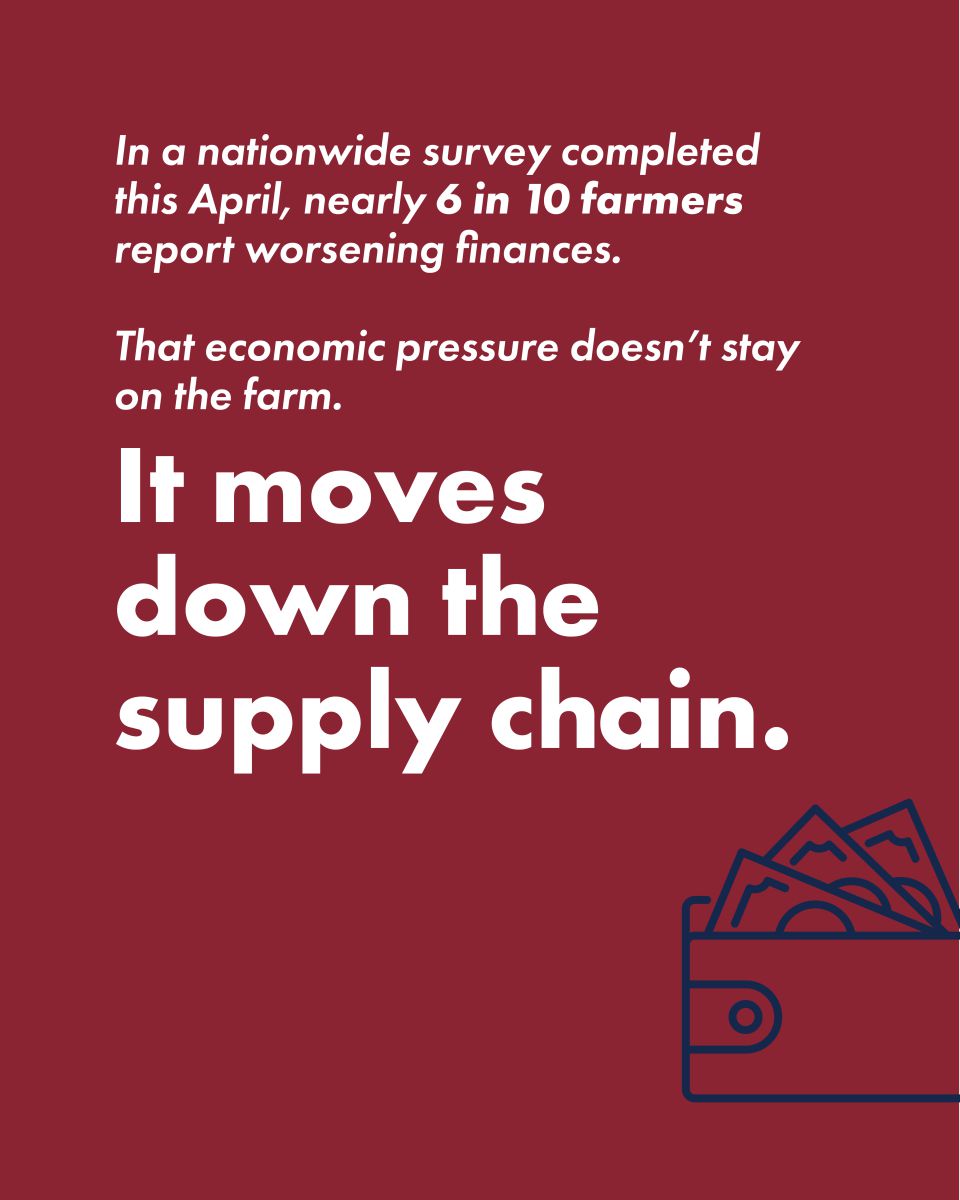
A nationwide American Farm Bureau Federation survey of farmers found that rising fertilizer and fuel costs are placing significant financial strain on agriculture, with 94% of respondents reporting their financial situation has worsened or stayed the same since 2025. Nearly 70% of farmers nationwide—and 78% in the South—say they cannot afford all the fertilizer they need, with Southern producers especially impacted. As a result, many farmers are reducing fertilizer use, cutting acreage, or switching crops—decisions that increase the risk of lower yields, reduced production, and continued financial pressure heading into the 2026 growing season.
Graphics for Social Media Use
Right click on the images below to download the full size graphic. They were designed to be shared on social media but please utilize in any way that helps get the message out.
Quicklinks:
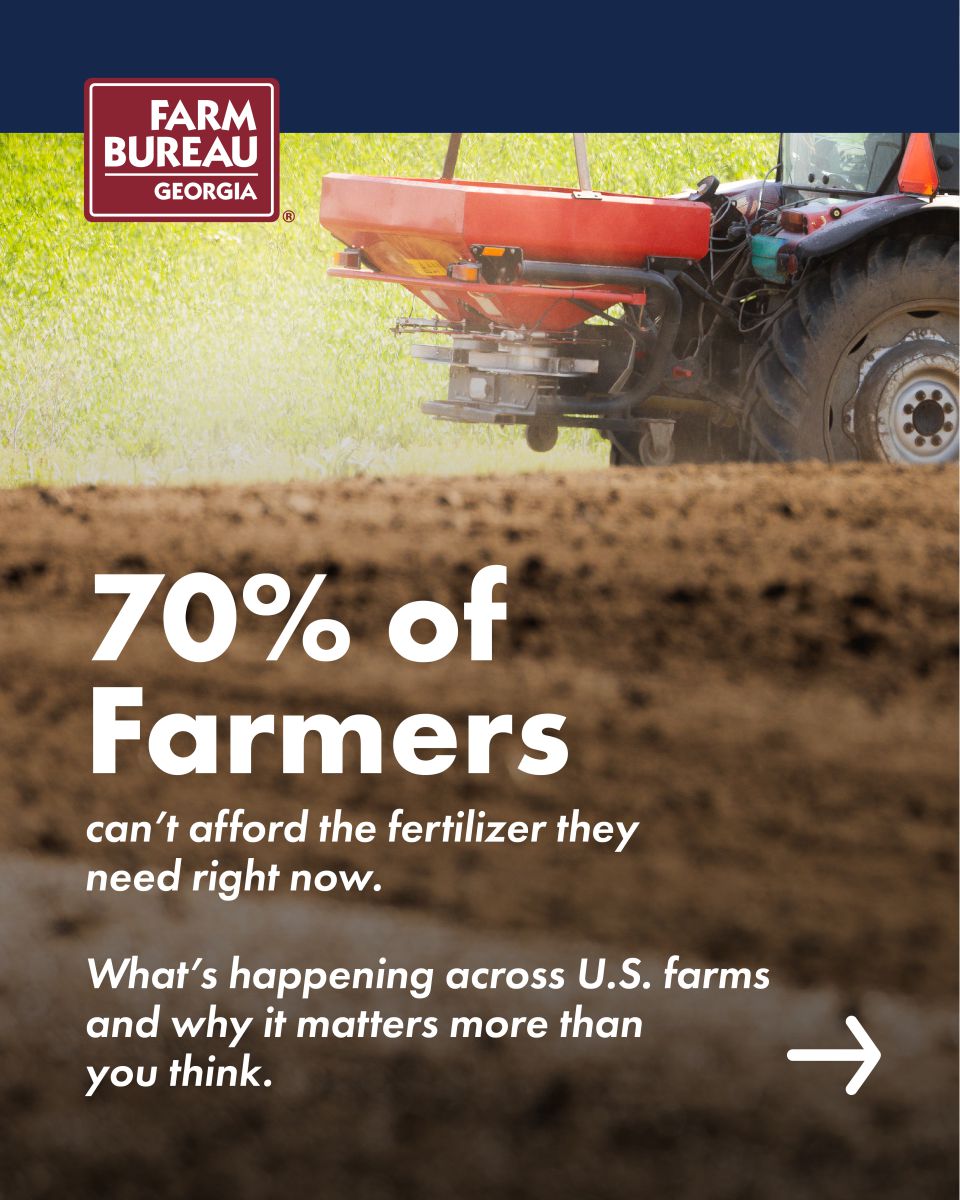
Results of AFBF Survey - 70% of Farmers Can't Afford Fertilizer
This educational carousel provides highlights from the recent nationwide survey from American Farm Bureau on the surging price of fertilizer.
How to use it: Right click to download and save the image, then upload to your social media platform of choice. Make sure to upload them in order to better tell the story. We recommend offering personal commentary based on your own experience.
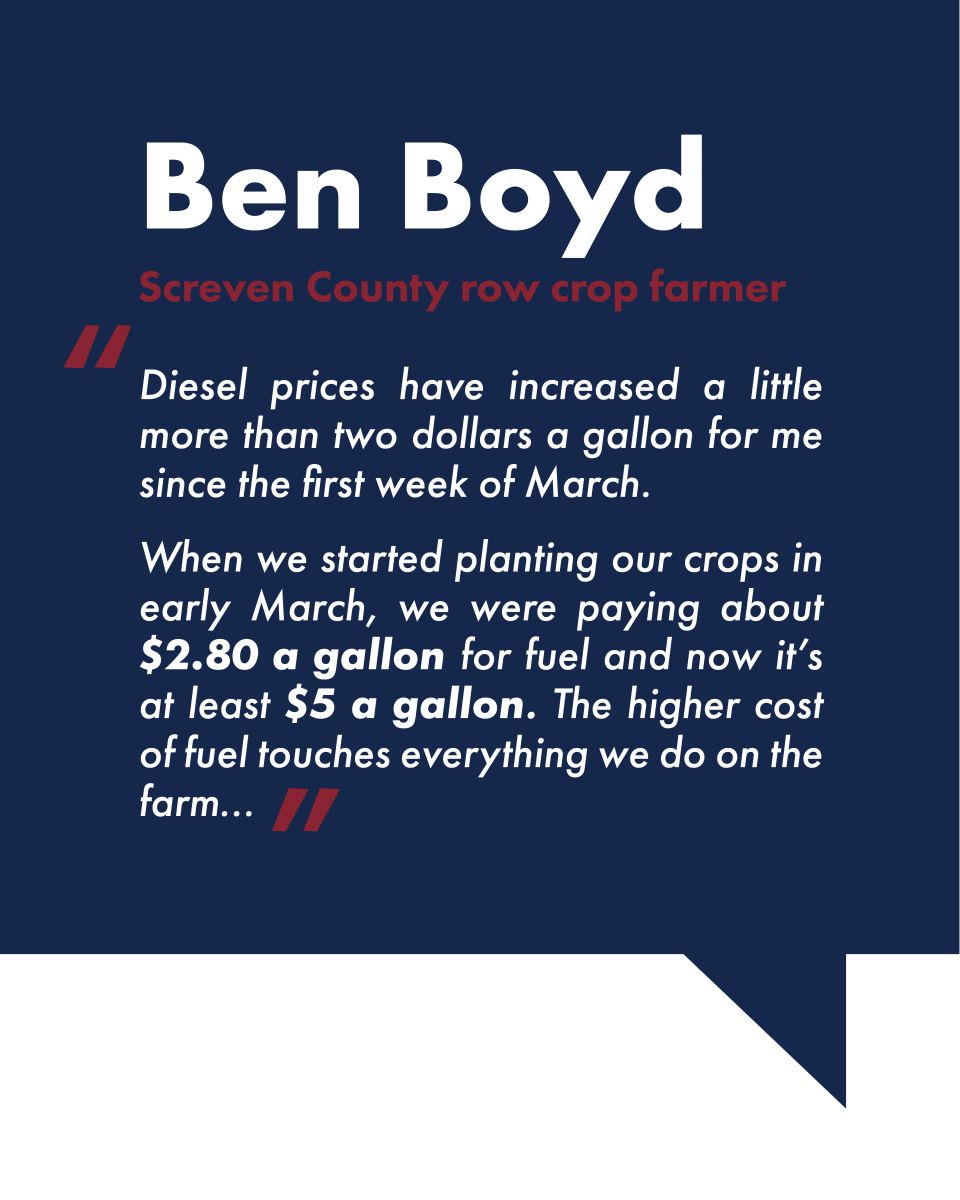
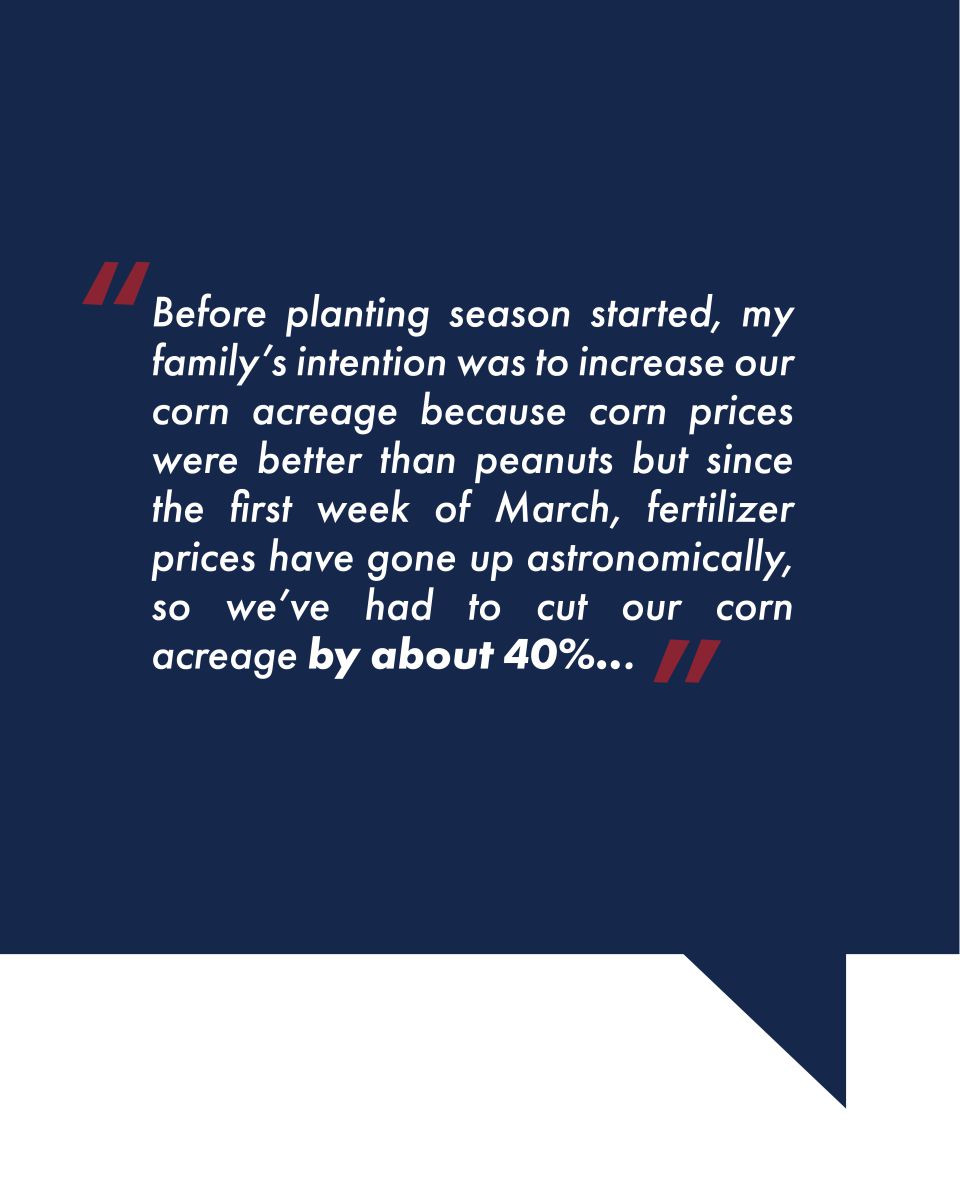
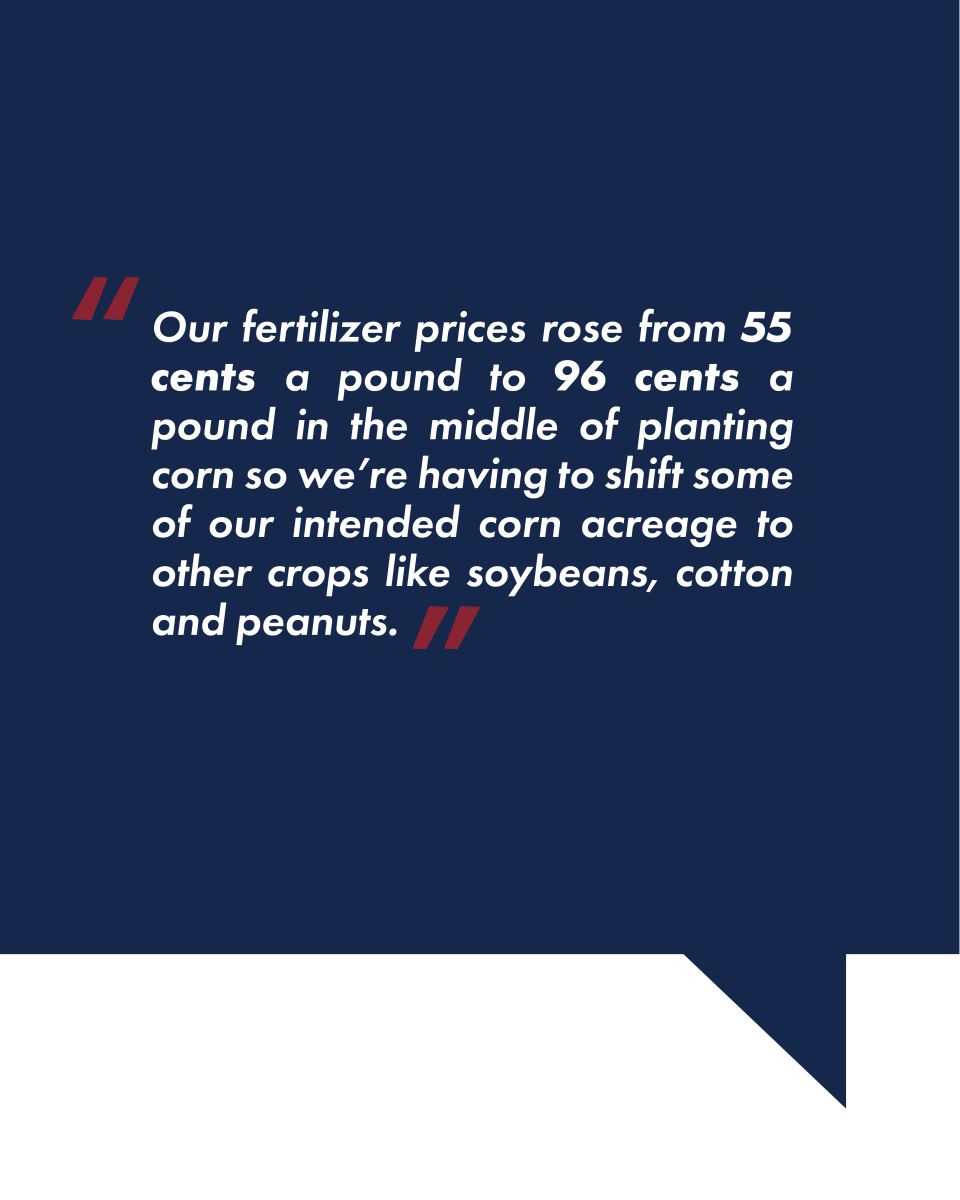
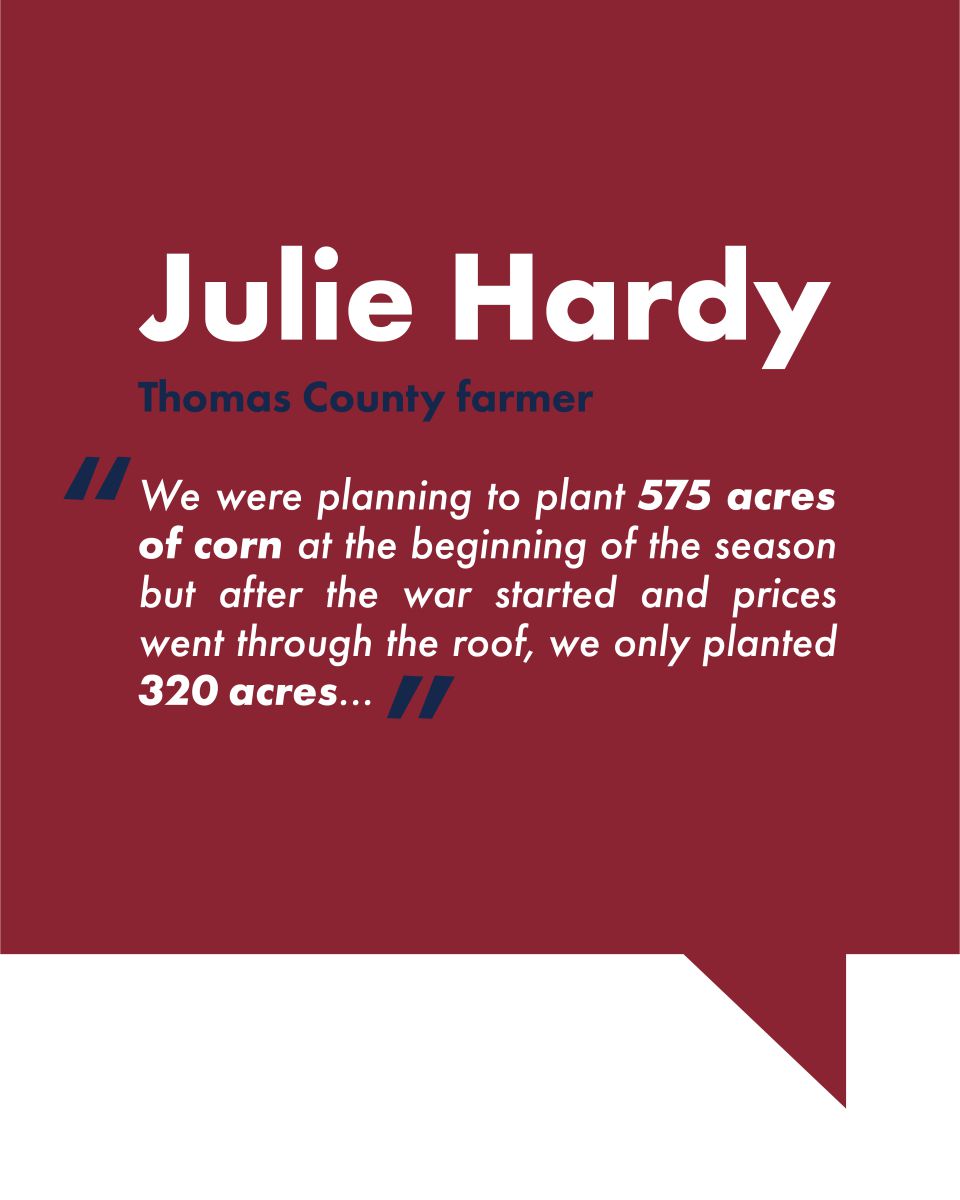
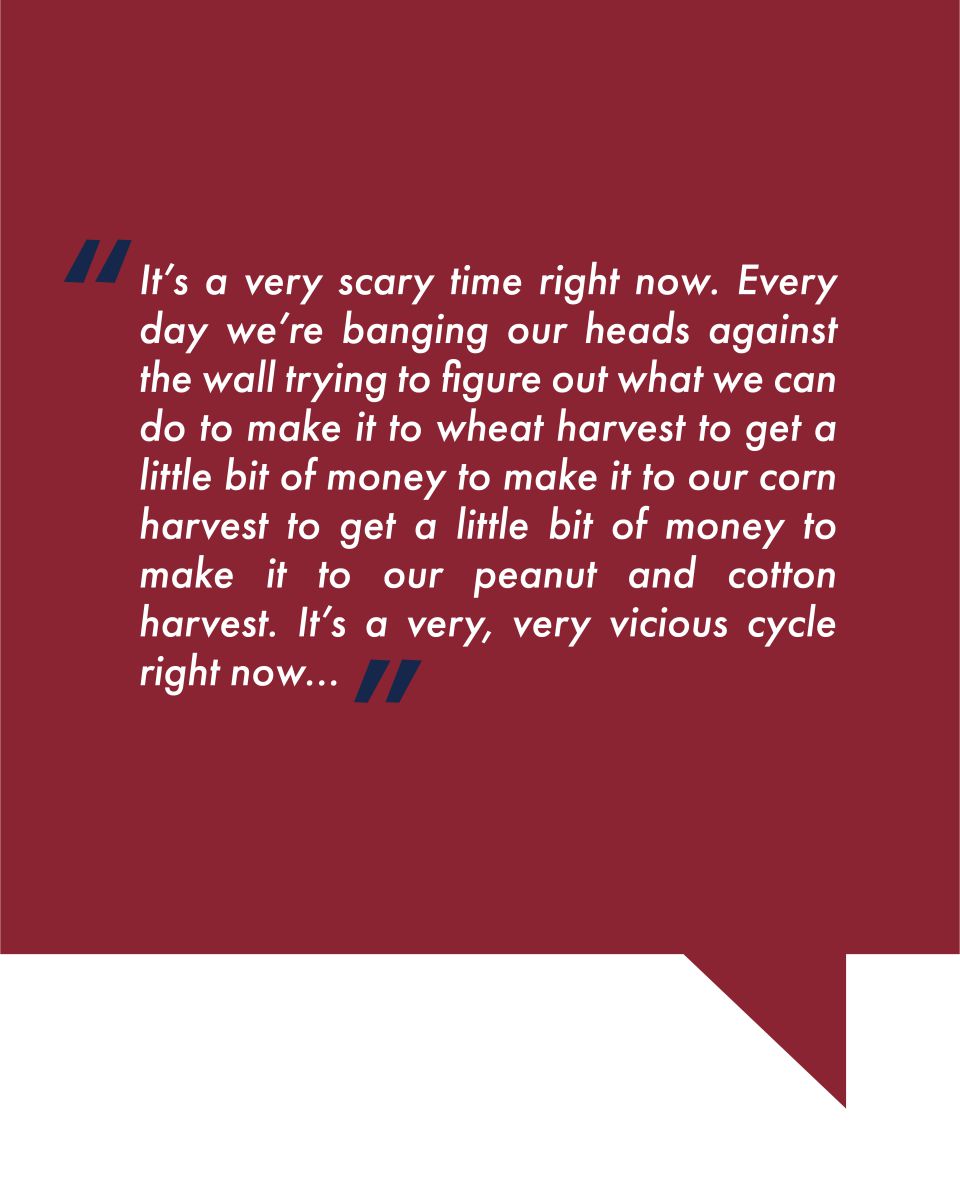
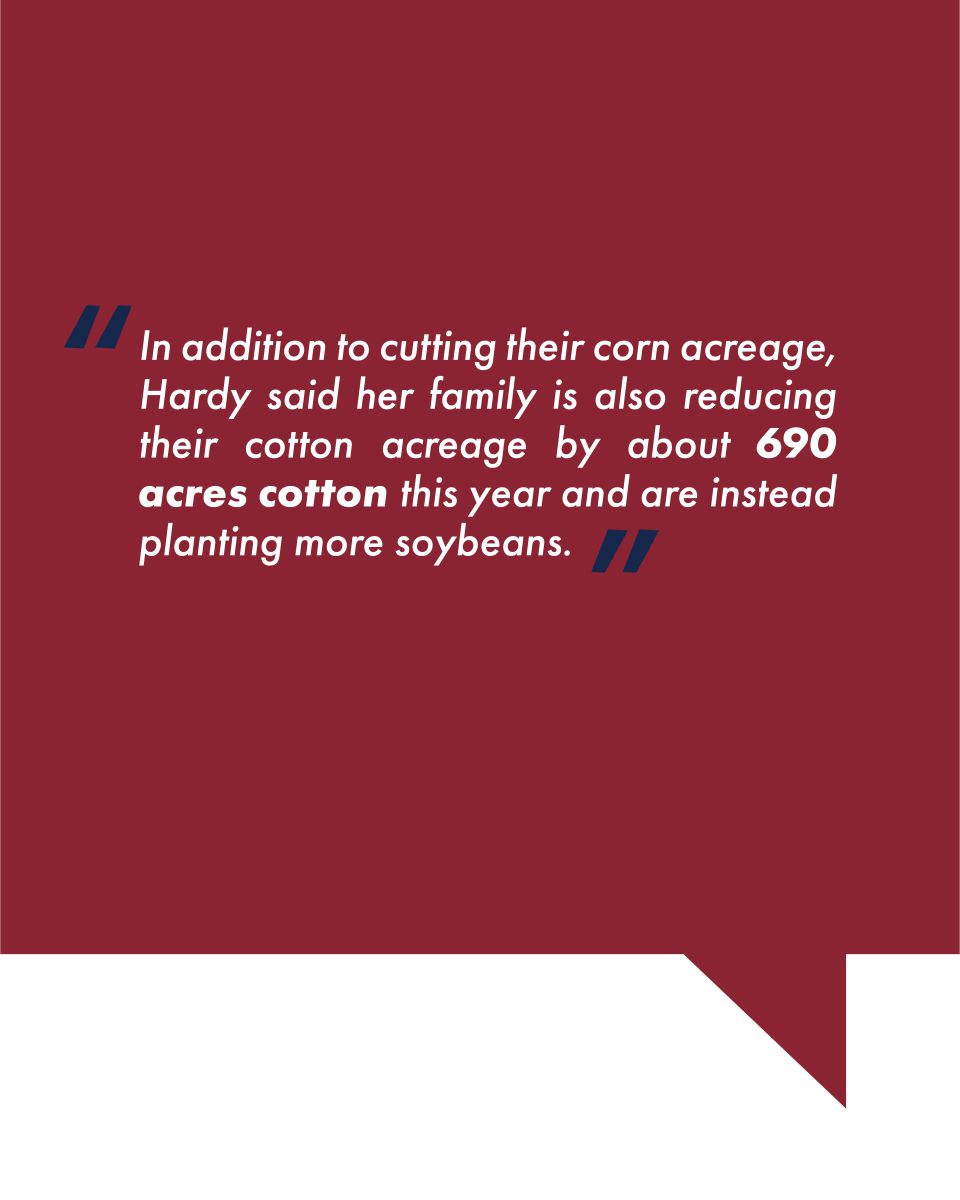
Rising Fertilizer Costs - What Real Farmers Are Saying
This educational carousel provides quotes from real farmers on how they are dealing with the surging costs of fertilizer.
How to use it: Right click to download and save the image, then upload to your social media platform of choice. Make sure to upload them in order to better tell the story. We recommend offering personal commentary based on your own experience.
Results of AFBF Survey on Fertilizer Costs - How This Affects Georgia Farmers
This graph shows how farmers in southern states are being hit even harder by the surging fertilizer costs.
How to use it: Right click to download and save the image, then upload to your social media platform of choice. We recommend offering personal commentary based on your own experience.
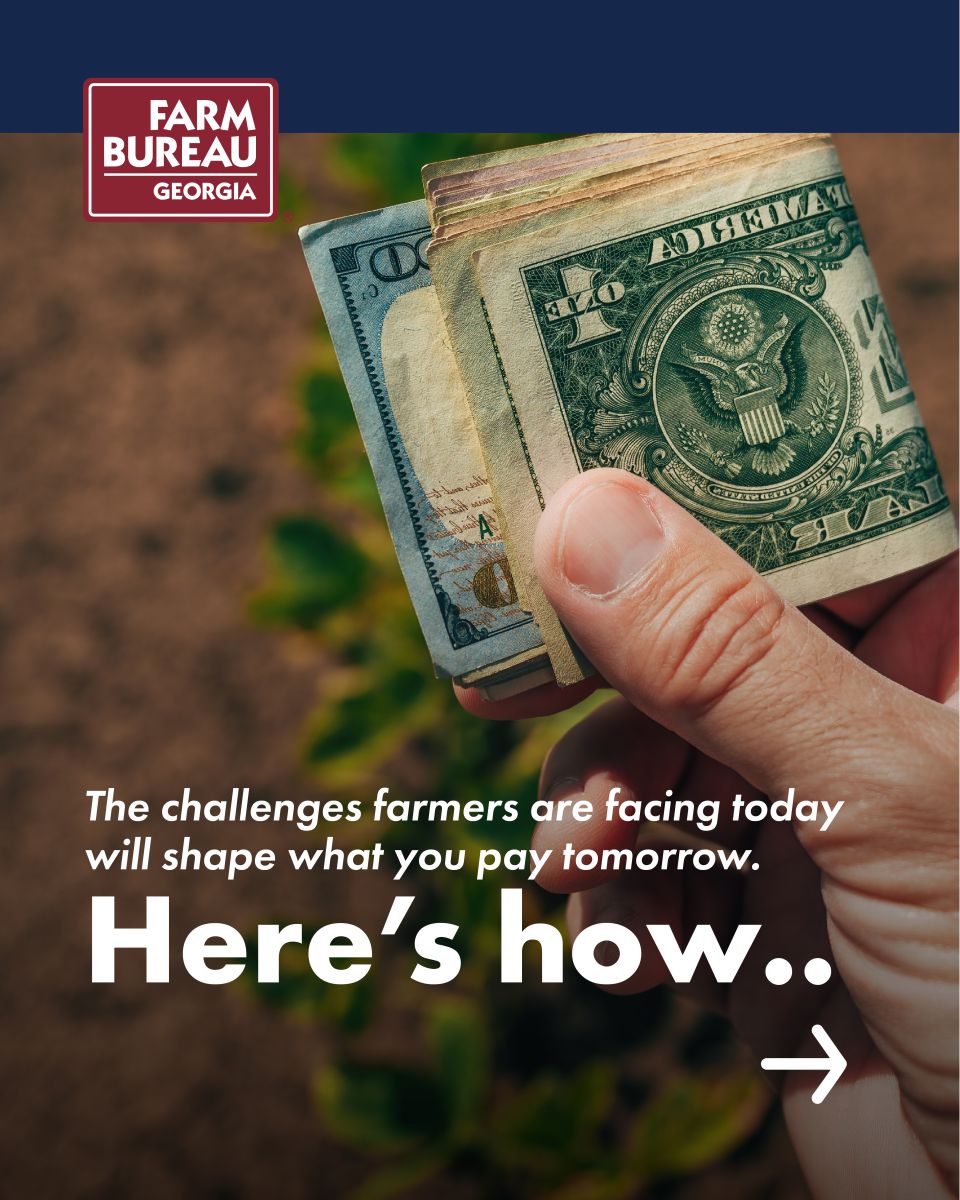
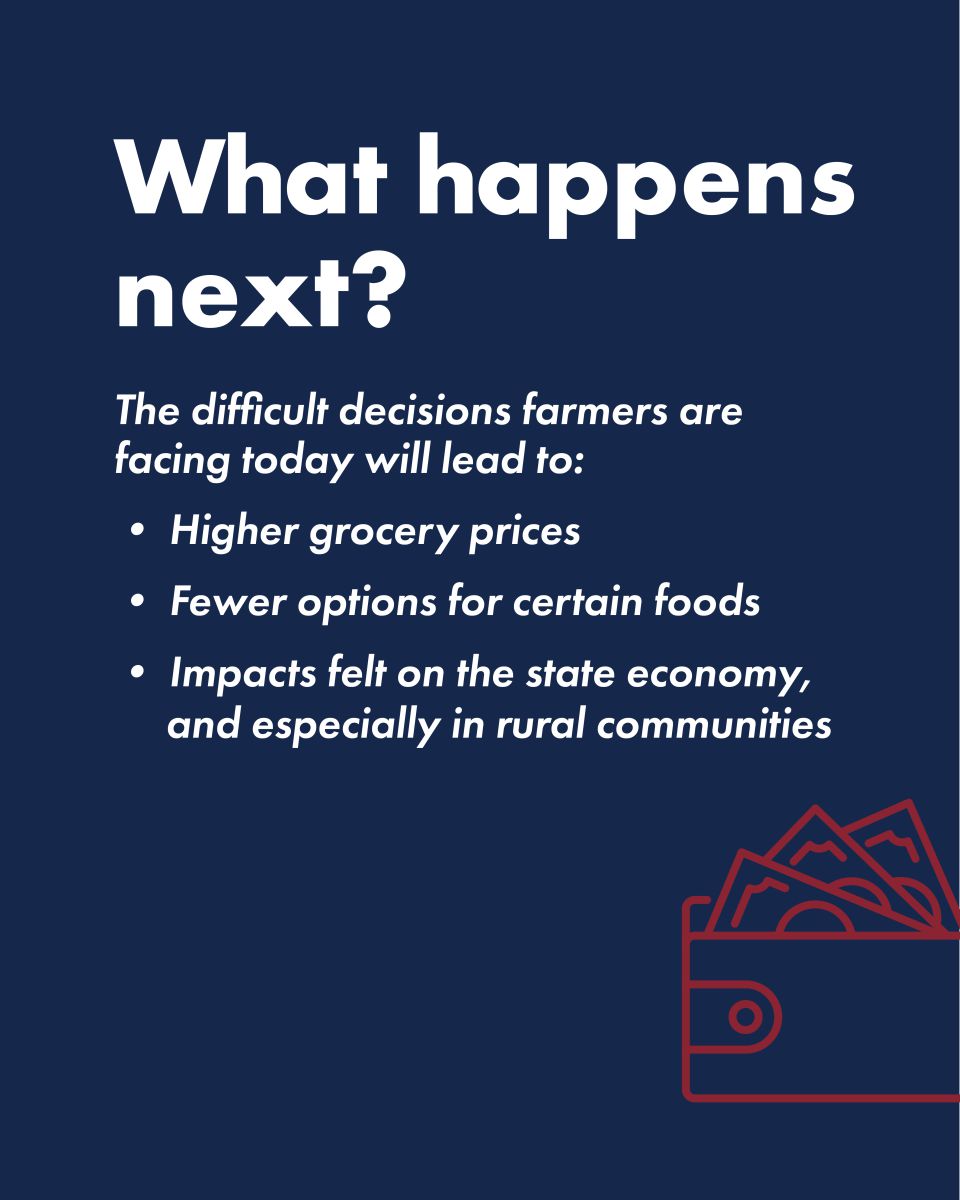
Surging Costs of Fertilizer and How Consumers Will Be Affected
This carousel helps educate consumers of the real-life impact the surging fertilizer costs will have on them and their bank account.
How to use it: Right click to download and save the image, then upload to your social media platform of choice. We recommend offering personal commentary based on your own experience.
Graphic for Price Index for Crop Producers
This graph shows the relationship between the prices paid by farmers and the the money they are able to get for their products.
How to use it: Right click to download and save the image, then upload to your social media platform of choice. We recommend offering personal commentary based on your own experience.
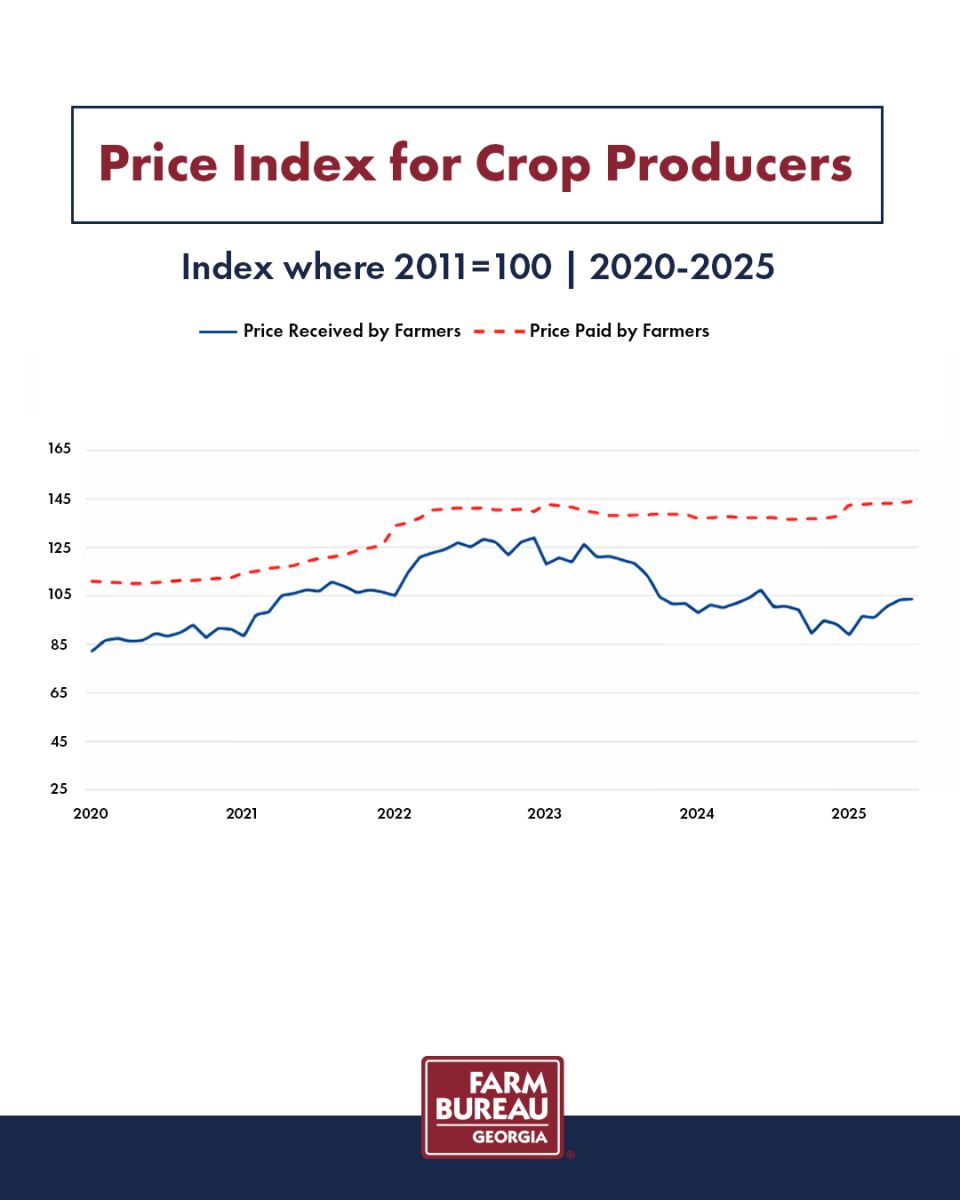
Source: American Farm Bureau Federation, afbf.org
We encourage you to come up with your own captions to make it personal, but if you'd feel more comfortable having someone else come up with something, please copy and paste one of the caption options below:
Caption Text to Copy and Paste - Option 1
The gap is growing, and Georgia farmers are feeling it. Input costs remain high while crop prices have declined, creating real financial pressure for family farms across our state. This imbalance affects more than individual operations — it impacts rural communities and Georgia’s agricultural future.
Help us educate consumers and elected leaders by sharing the facts. Visit https://gfb.ag/strongfarms to learn more and share this information with your community. #StrongFarmsStrongGA
Caption Text to Copy and Paste - Option 2
Rising costs and lower crop prices are creating tighter margins for Georgia farmers. This chart highlights the widening gap between what farmers are paid and what they must spend to grow our food and fiber. When that gap persists, the pressure on farm families increases.
Take a moment to understand what’s happening in agriculture today. Visit https://gfb.ag/strongfarms to learn the facts and help us educate consumers and elected leaders by sharing them. #StrongFarmsStrongGA
Caption Text to Copy and Paste - Option 3
Georgia farmers cannot control global markets, but we can help tell their story. Production costs remain elevated while crop prices have softened, putting sustained pressure on farm families and rural communities across our state. These challenges are real, and understanding them matters.
Visit https://gfb.ag/strongfarms to get the facts and help us educate consumers and elected leaders by sharing this information and standing with Georgia agriculture. #StrongFarmsStrongGA
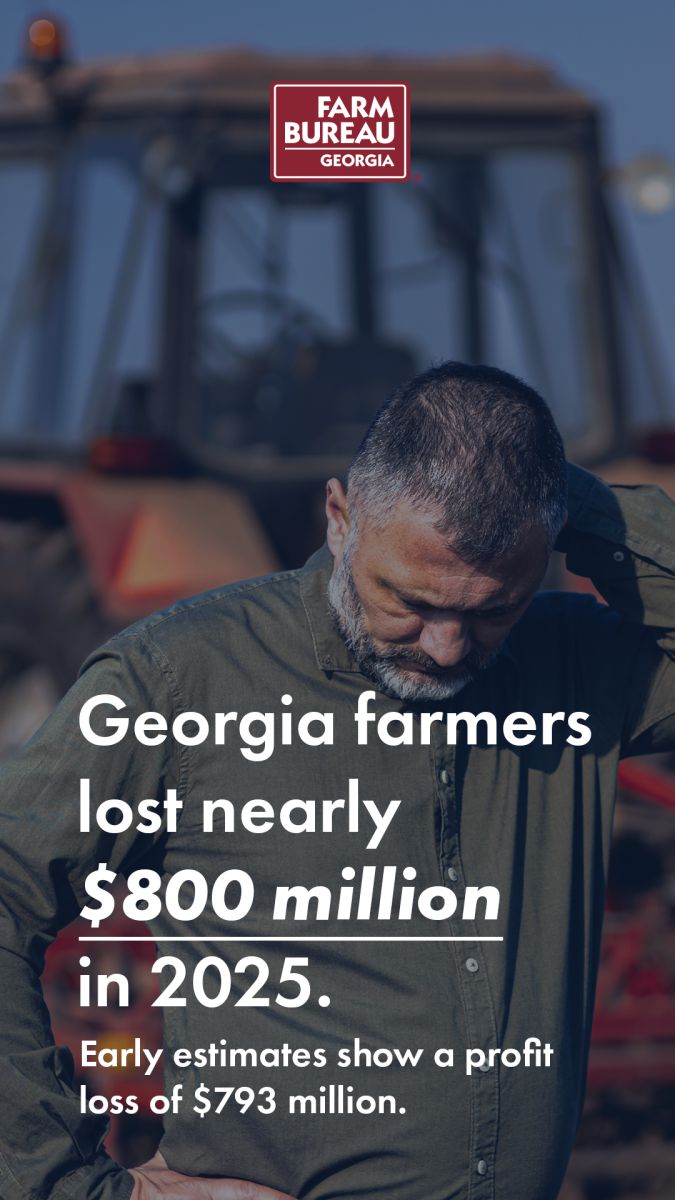
Graphic: Georgia farmers lost nearly $800 million in 2025
This graph shows the projected profit loss specific to Georgia farmers in 2025.
How to use it: Right click to download and save the image, then upload to your social media platform of choice. We recommend offering personal commentary based on your own experience.
POST:
.jpg)
STORY:
We encourage you to come up with your own captions to make it personal, but if you'd feel more comfortable having someone else come up with something, please copy and paste one of the caption options below:
Caption Text to Copy and Paste - Option 1
Georgia farmers lost nearly $800 million in 2025. That figure represents real financial losses for farm families across our state as production costs remained high and returns declined. Learn more about what contributed to these losses and help us educate consumers and elected leaders by sharing the facts: https://gfb.ag/strongfarms #StrongFarmsStrongGA
Caption Text to Copy and Paste - Option 2
In 2025, Georgia farmers lost nearly $800 million. Behind that number are family farms navigating rising expenses, tight margins and challenging market conditions.
Visit https://gfb.ag/strongfarms to understand what’s happening in agriculture and help us educate consumers and elected leaders by sharing this information. #StrongFarmsStrongGA
Caption Text to Copy and Paste - Option 3
Nearly $800 million. That’s what Georgia farmers lost in 2025.
These losses highlight the financial realities facing agriculture in our state and why informed conversations about farm policy and economic conditions matter.
Get the facts and share them at https://gfb.ag/strongfarms #StrongFarmsStrongGA
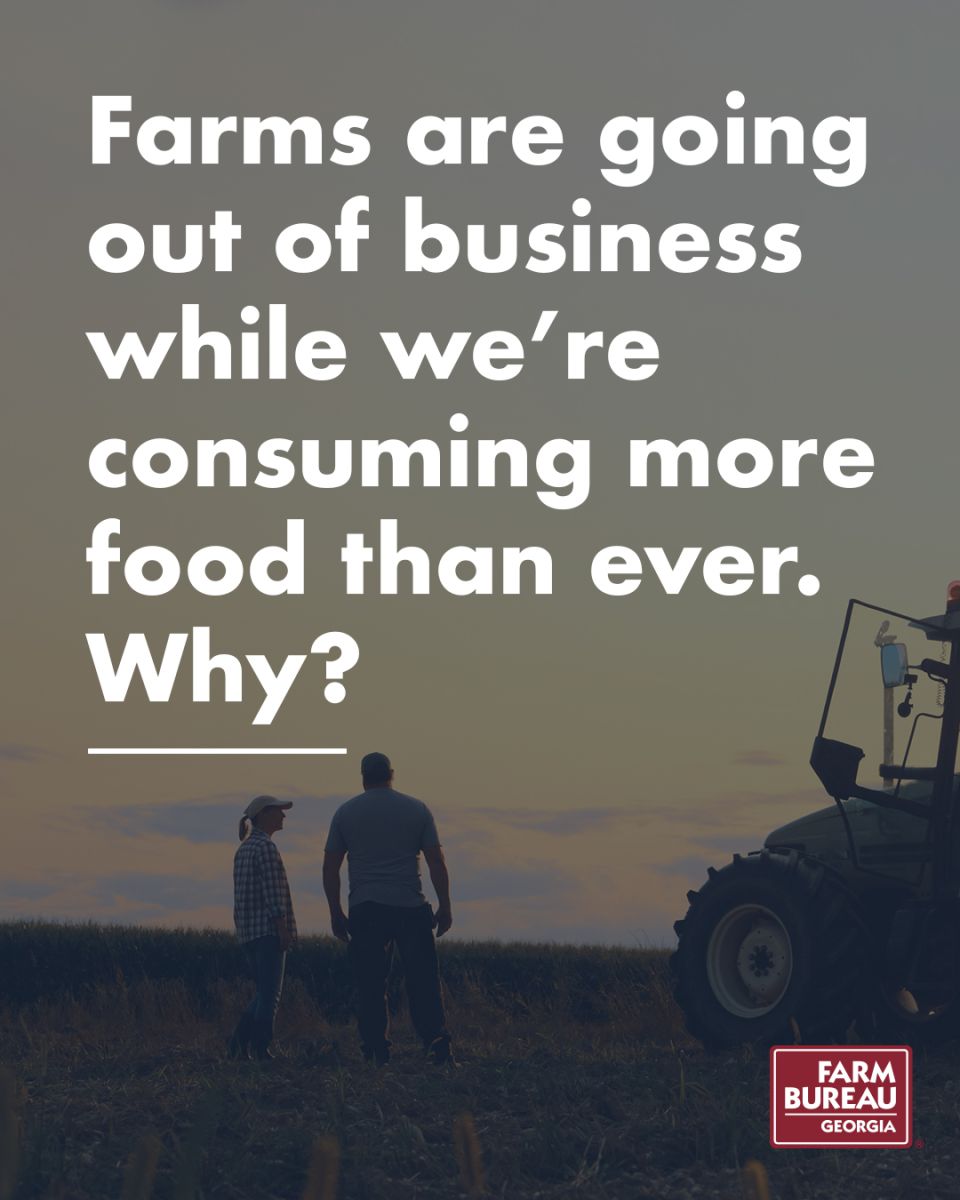
Informational Carousel: Why Farmers Are Going Out of Business
This educational carousel will help tell the story of why America is losing so many of its family farms.
How to use it: Right click to download and save each of the images, then upload them to Instagram or Facebook. Make sure to upload them in order so it tells the story. Viewers will swipe left to get to the next slide. These can be used as posts or stories.
SLIDE 1:
SLIDE 2:
SLIDE 3:
SLIDE 4:
We encourage you to come up with your own captions to make it personal, but if you'd feel more comfortable having someone else come up with something, please copy and paste one of the caption options below:
Caption Text to Copy and Paste - Option 1
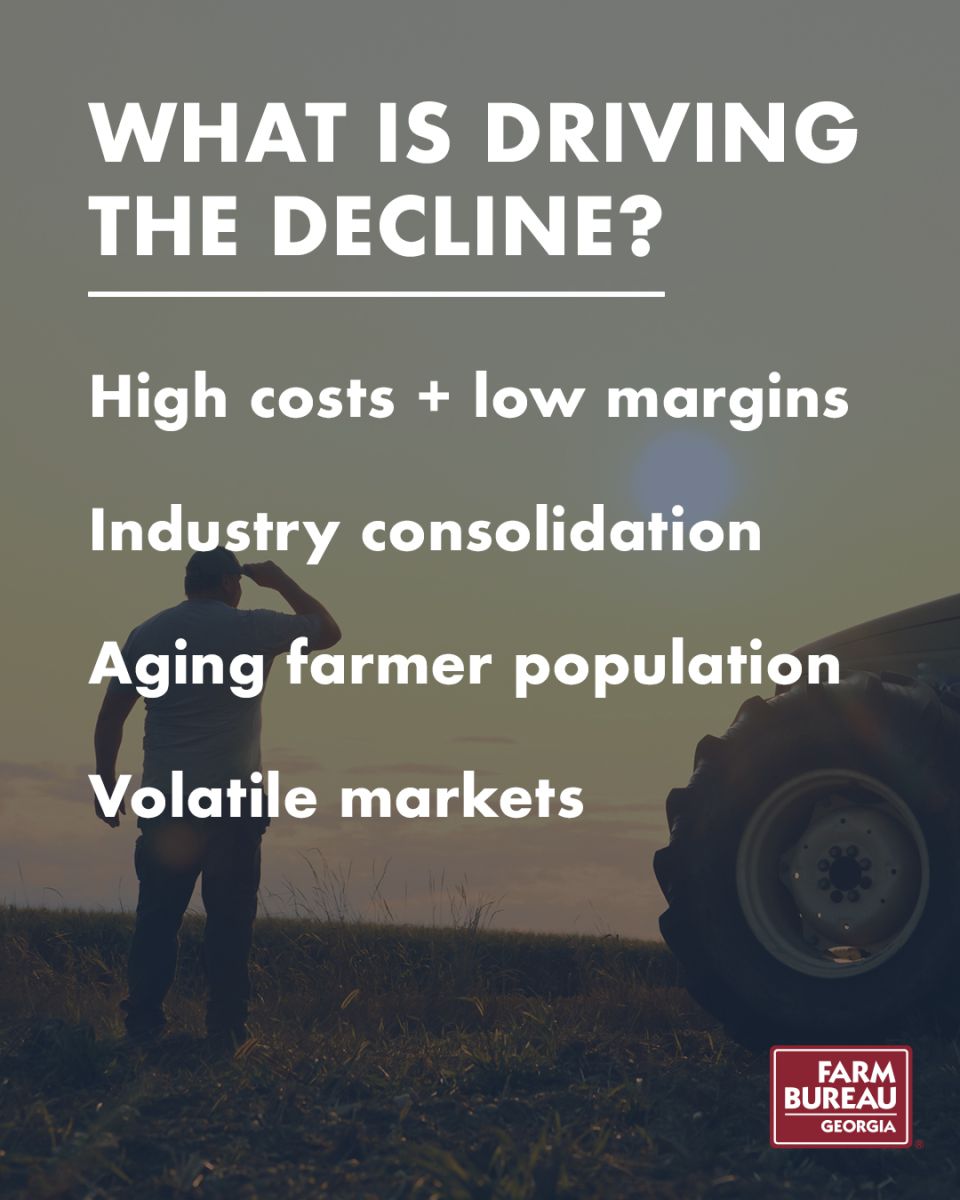
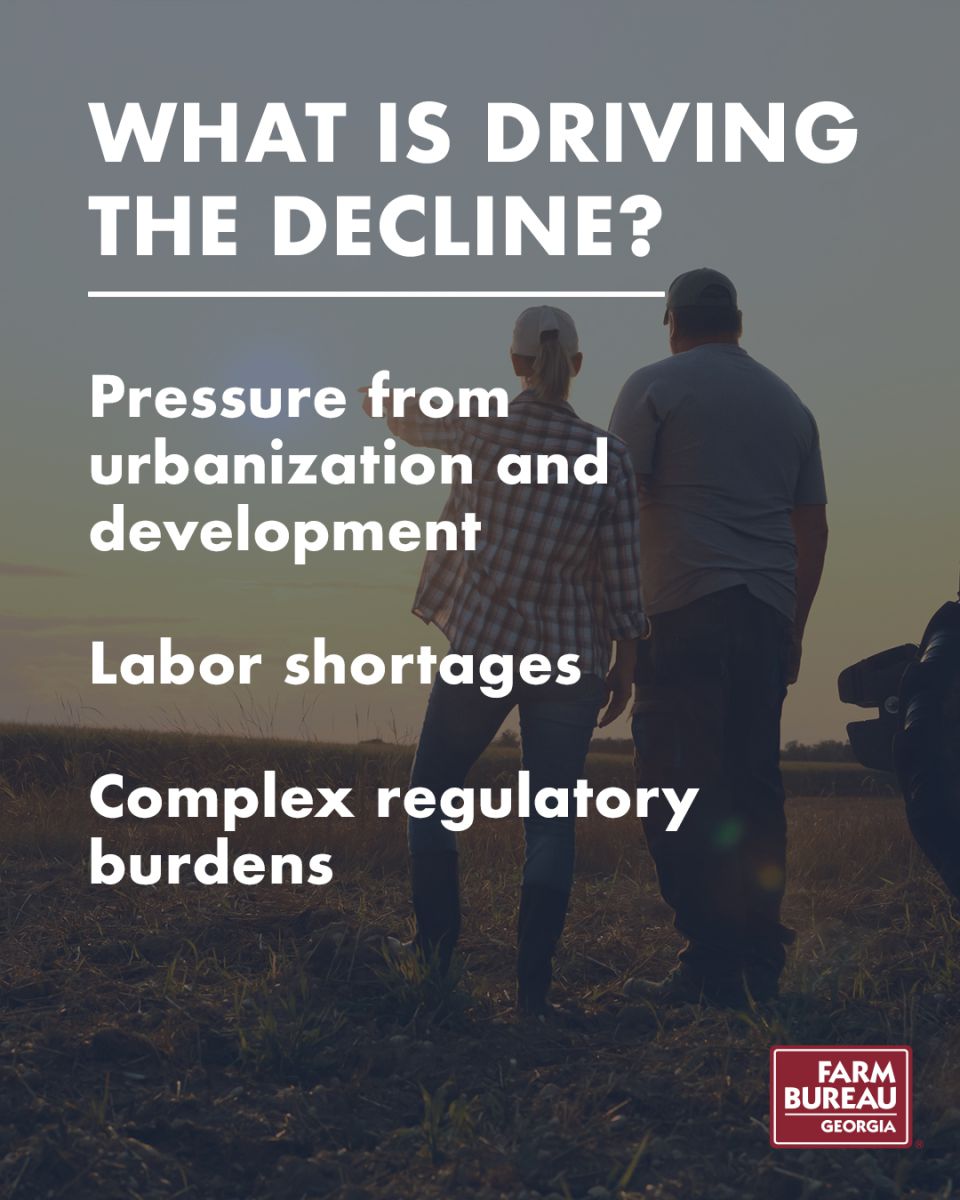
Farms are going out of business — even as food demand grows. High costs. Thin margins. Labor shortages. Regulatory pressure. Market volatility.The challenges are real for Georgia farm families.
Learn what’s driving the decline and help us educate consumers and elected leaders by sharing the facts: https://gfb.ag/strongfarms #StrongFarmsStrongGA
Caption Text to Copy and Paste - Option 2
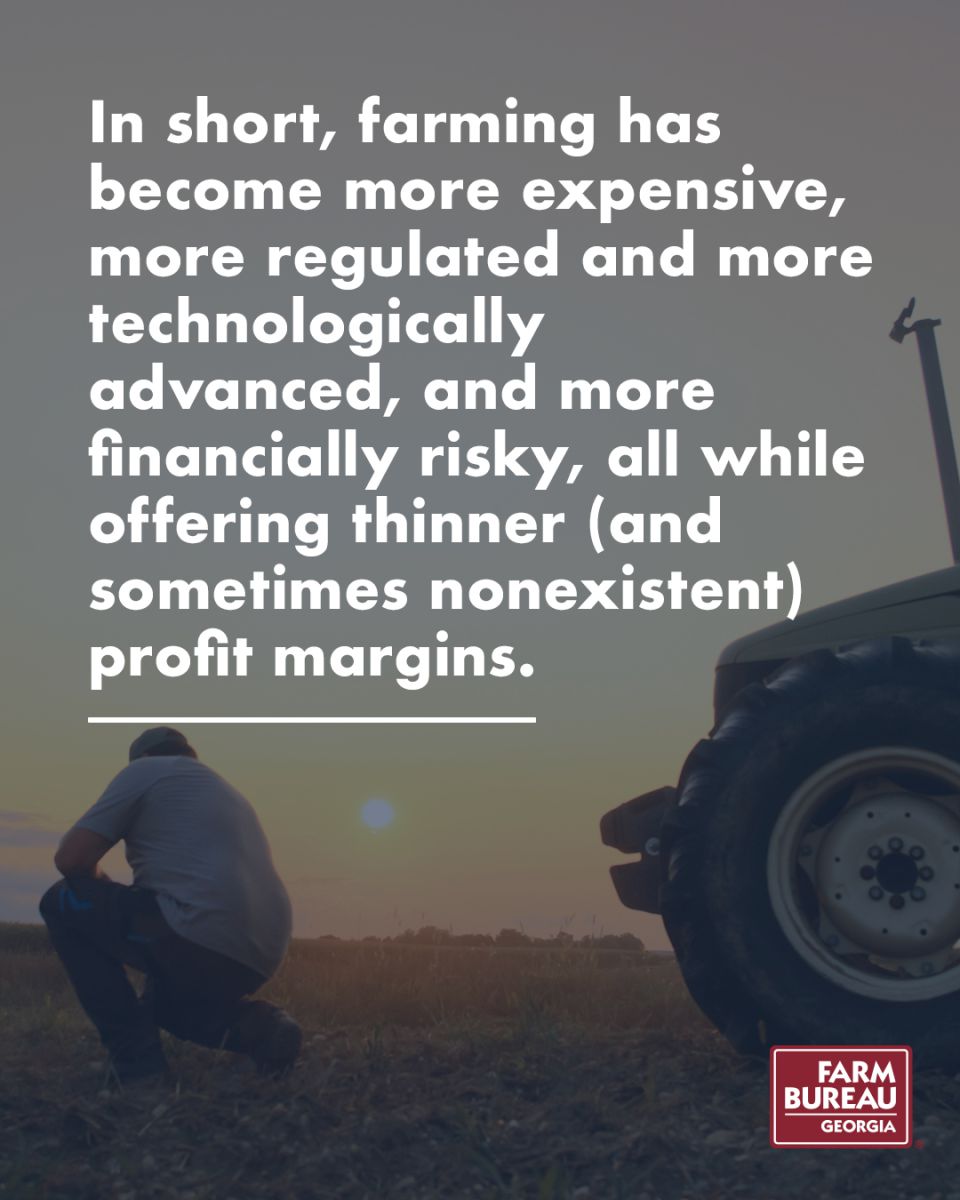
Farming today is more expensive, more regulated and more financially risky — often with little room for profit.
At the same time, farms are facing consolidation, labor shortages, volatile markets and increasing development pressure. Understanding these realities is the first step toward meaningful solutions.
Visit https://gfb.ag/strongfarms to learn more and help us educate consumers and elected leaders by sharing this information. #StrongFarmsStrongGA
Caption Text to Copy and Paste - Option 3
While we are consuming more food than ever, farms are disappearing. Rising costs and shrinking margins make it difficult for family farms to stay in business. Add regulatory burdens, labor challenges and market instability, and the pressure grows even greater.
Get informed about what is driving the decline and help us share the facts: https://gfb.ag/strongfarms #StrongFarmsStrongGA
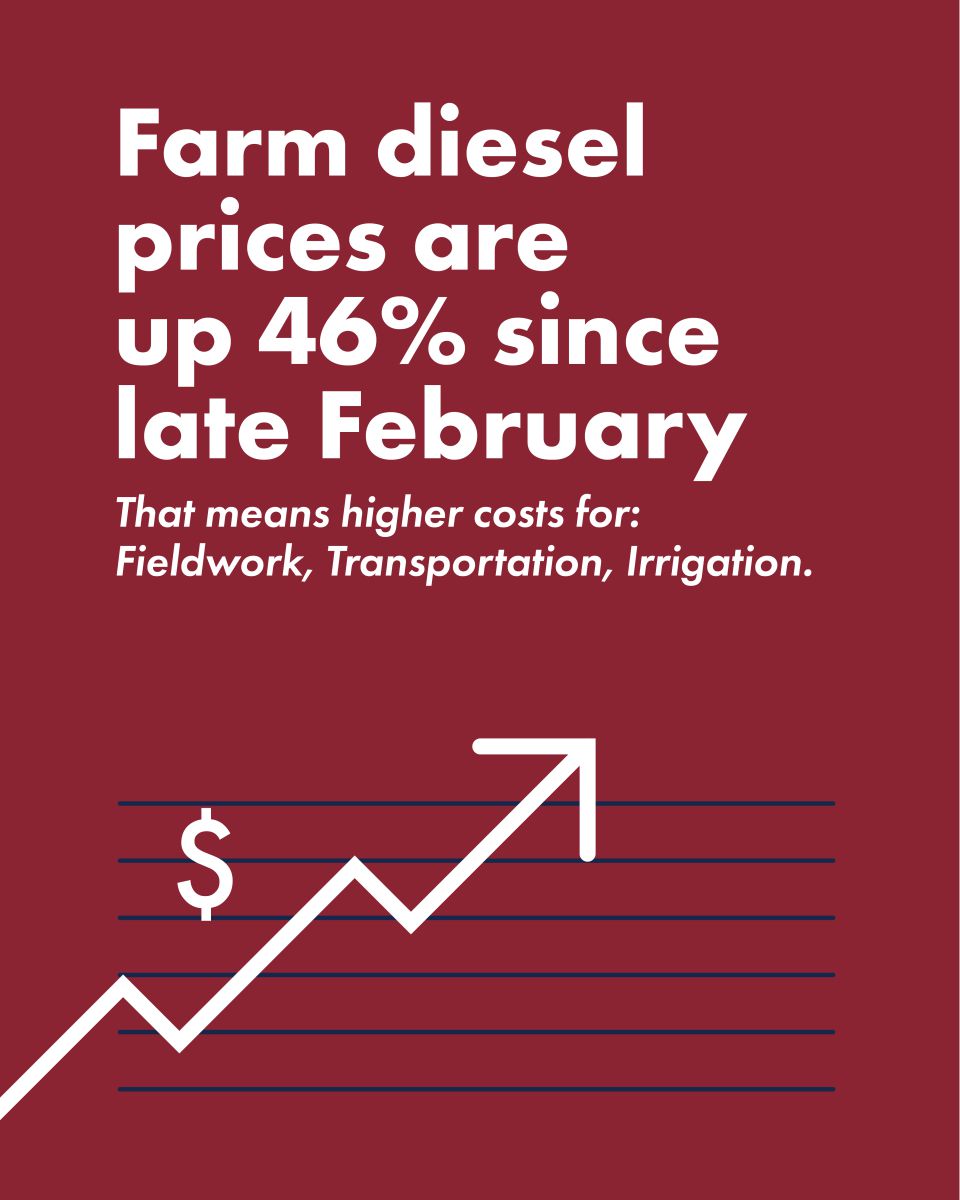
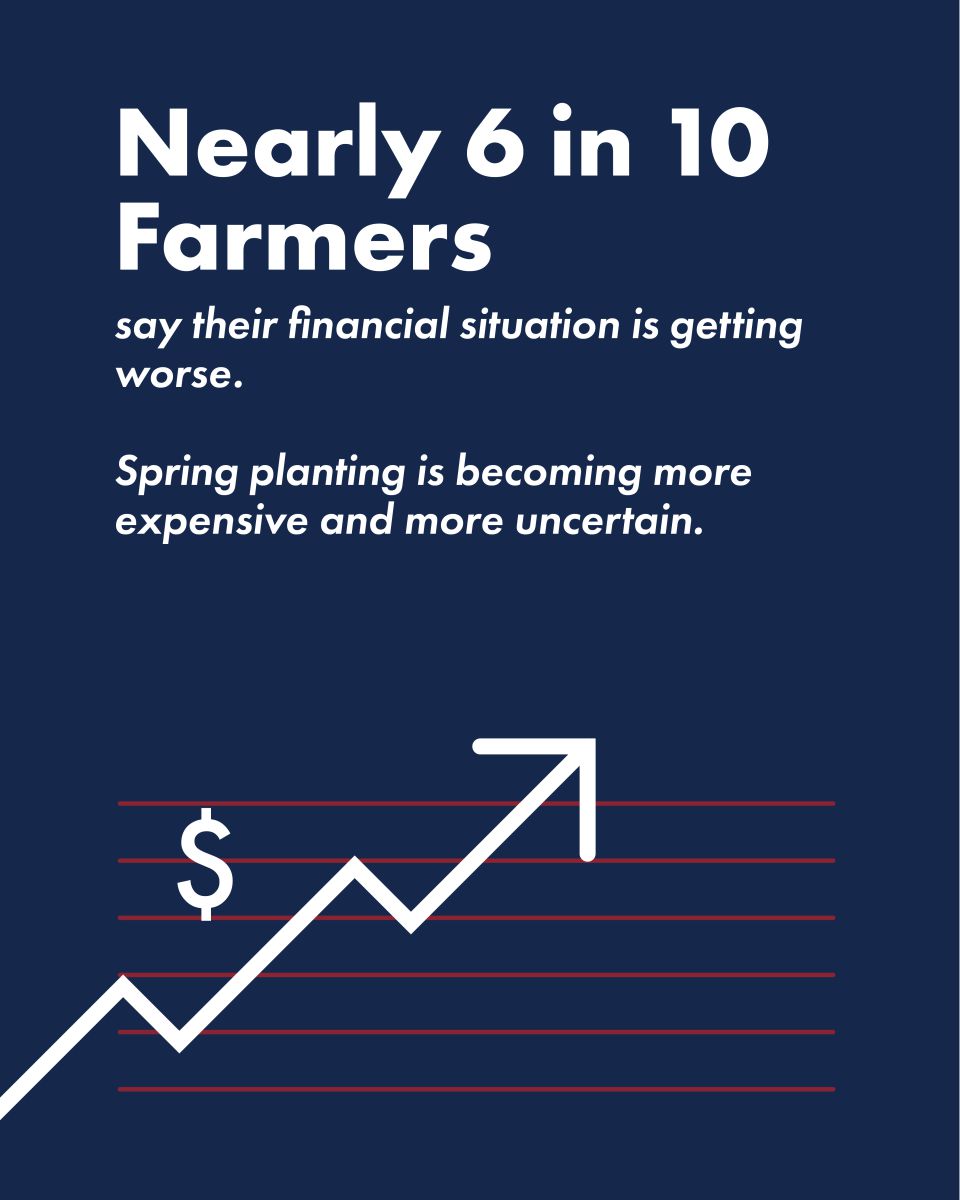
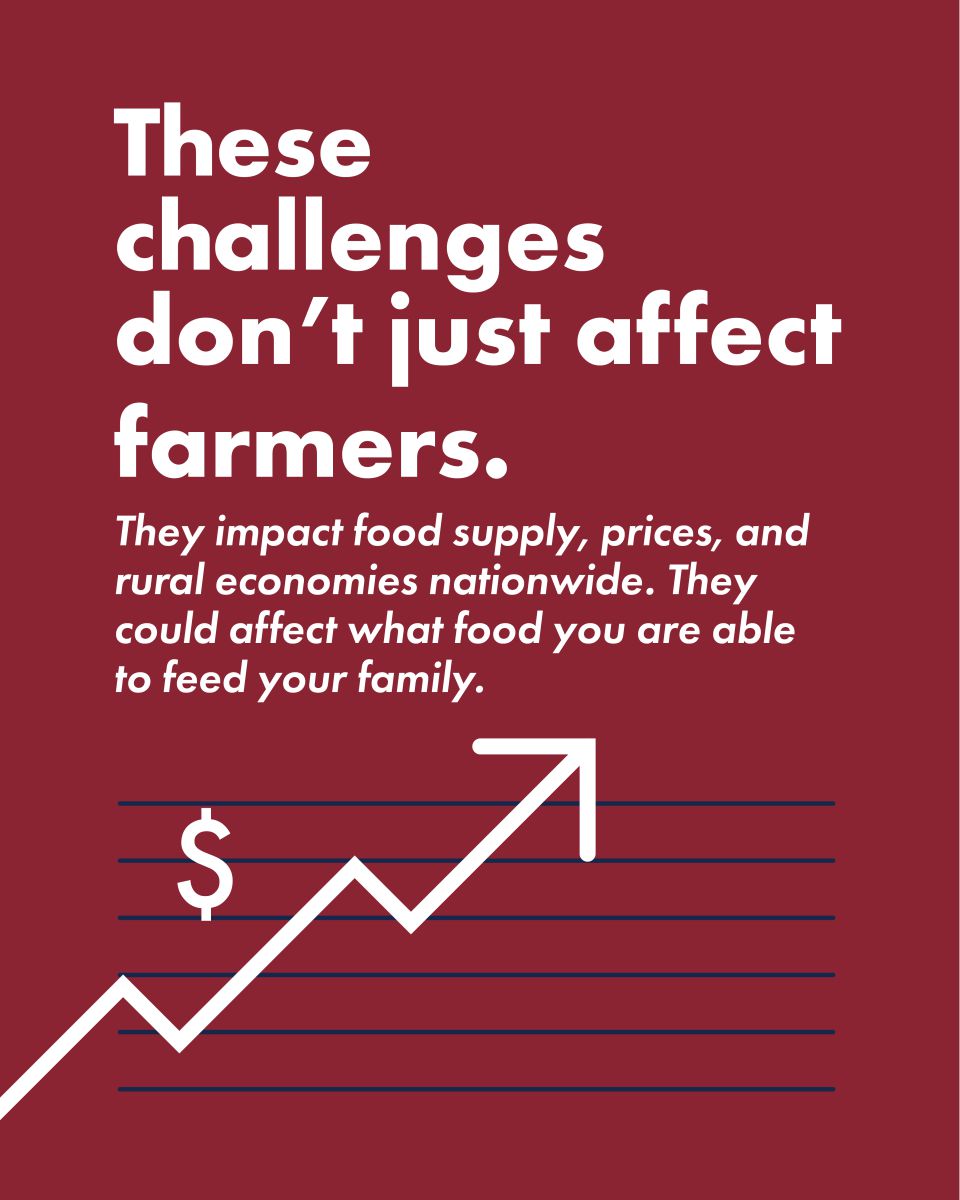
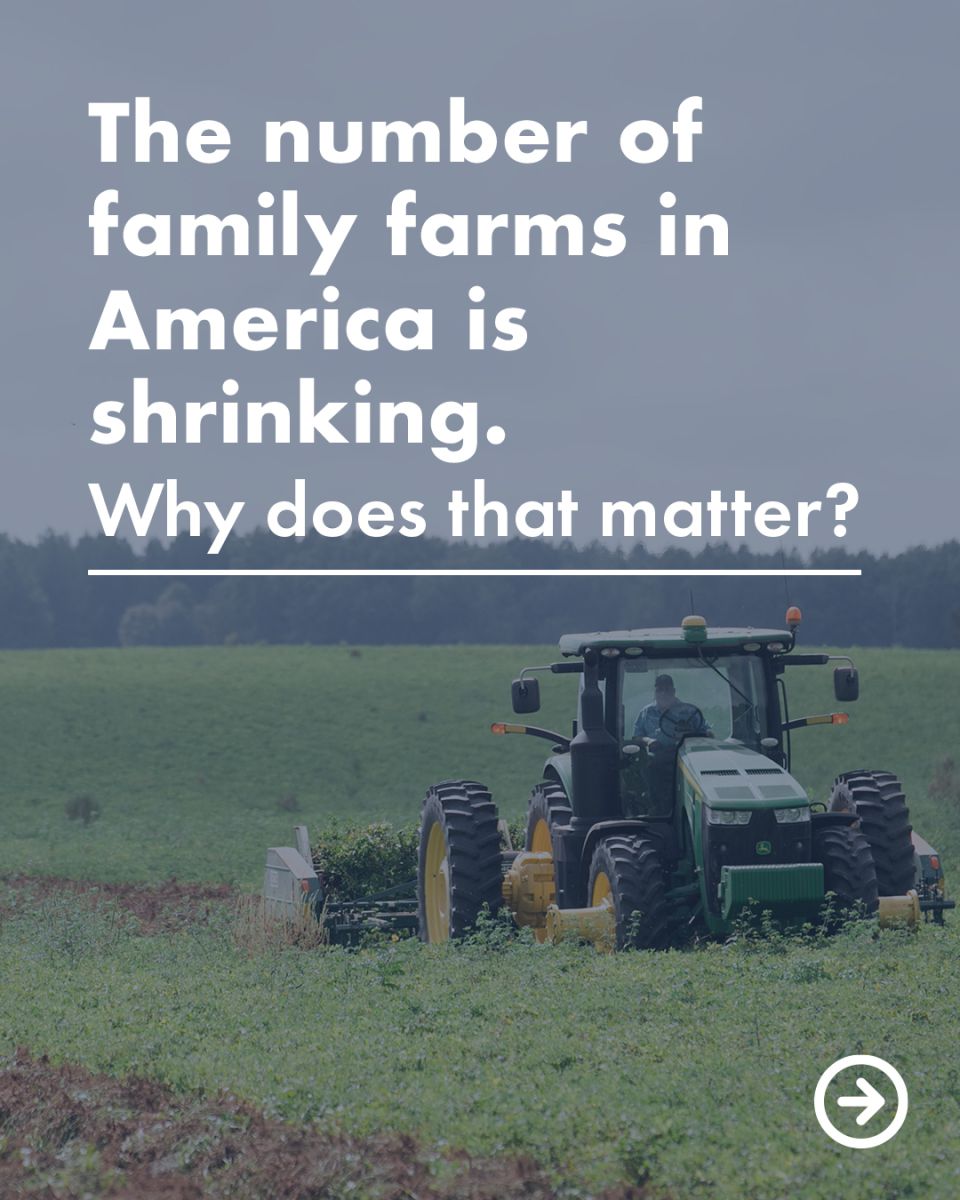
Informational Carousel: Why It Matters
This educational carousel will help tell the story of why this information should matter to every American.
How to use it: Right click to download and save each of the images, then upload them to Instagram or Facebook. Make sure to upload them in order so it tells the story. Viewers will swipe left to get to the next slide. These can be used as posts or stories.
SLIDE 1:
SLIDE 2:
SLIDE 3:
SLIDE 4:
SLIDE 5:
SLIDE 6:
SLIDE 7:
SLIDE 8:
We encourage you to come up with your own captions to make it personal, but if you'd feel more comfortable having someone else come up with something, please copy and paste one of the caption options below:
Caption Text to Copy and Paste - Option 1
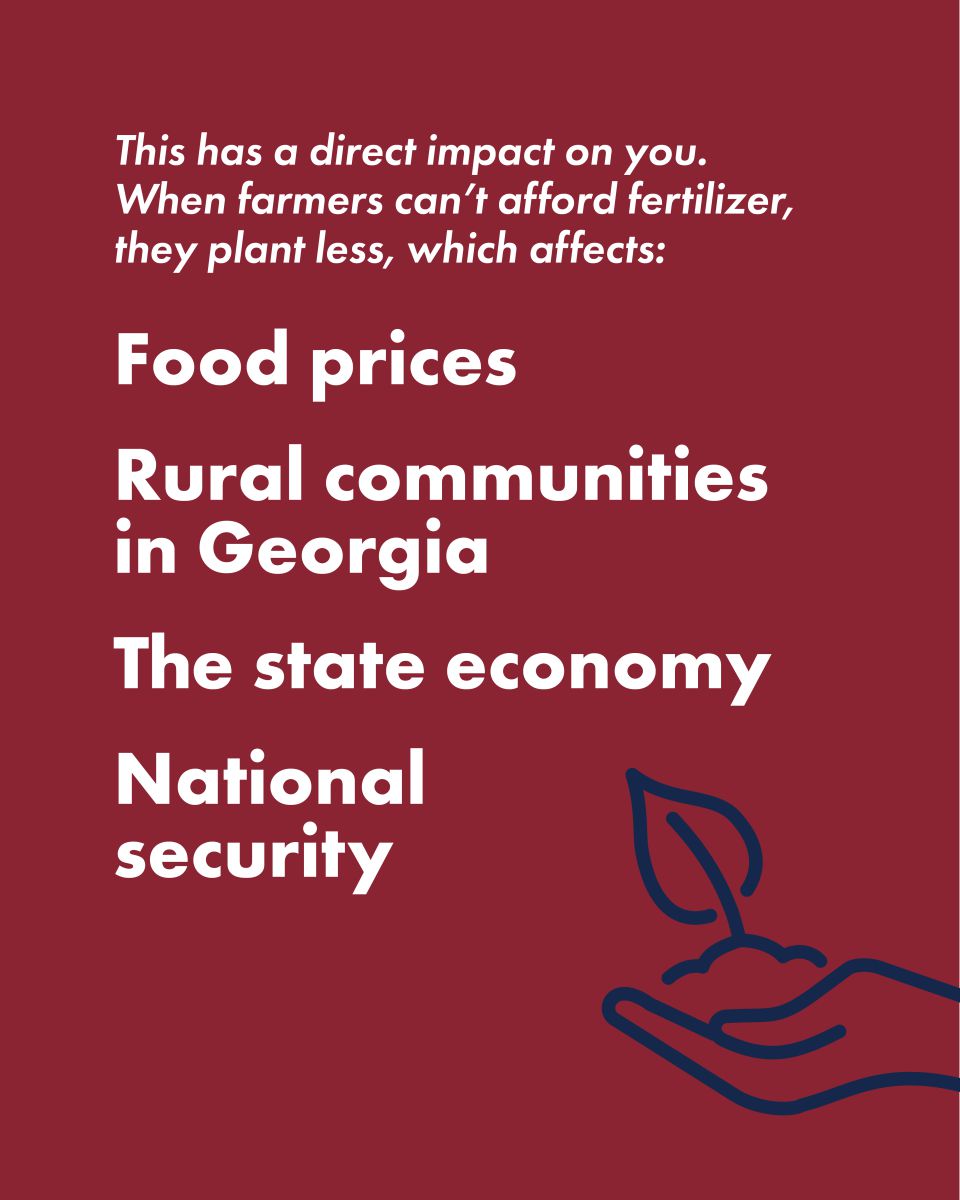
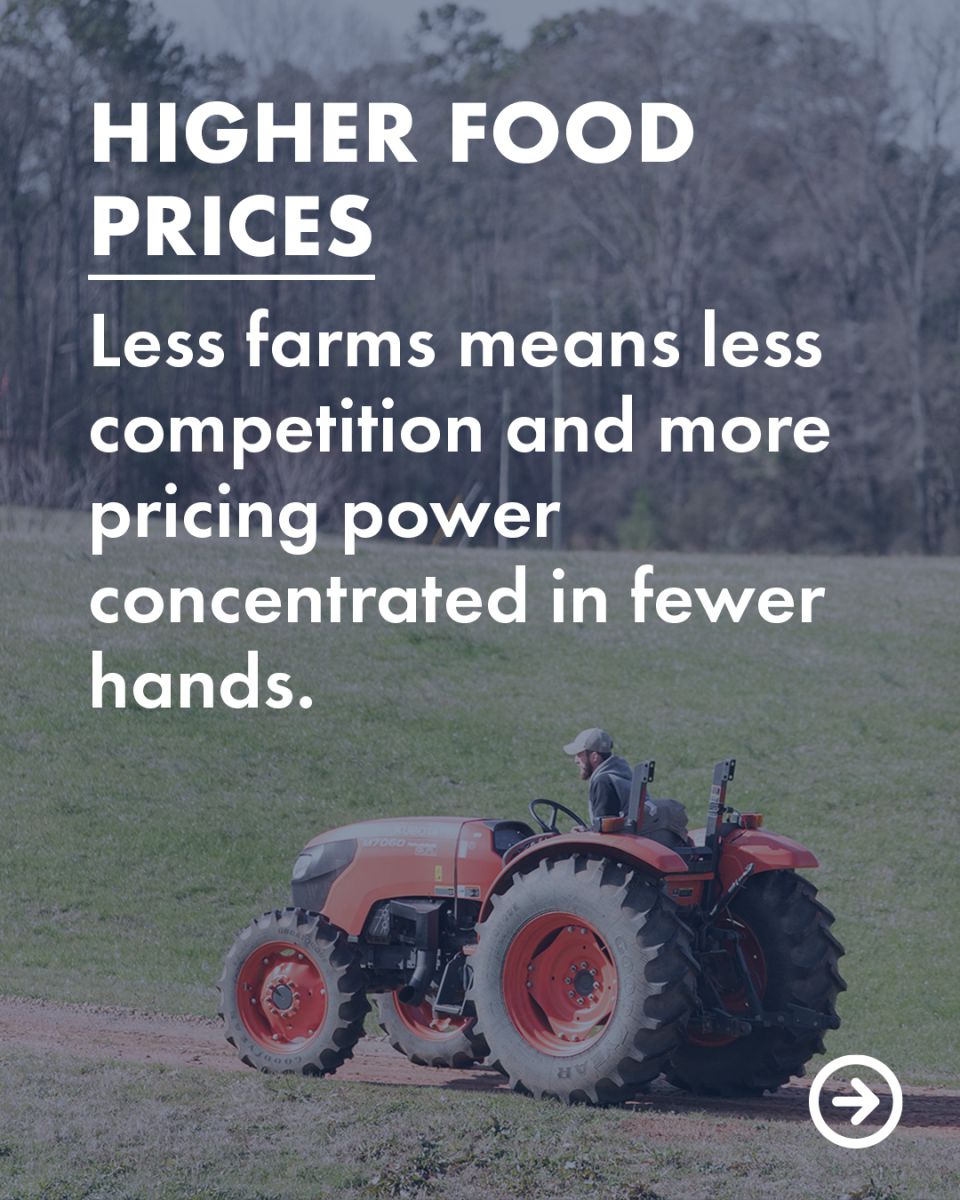
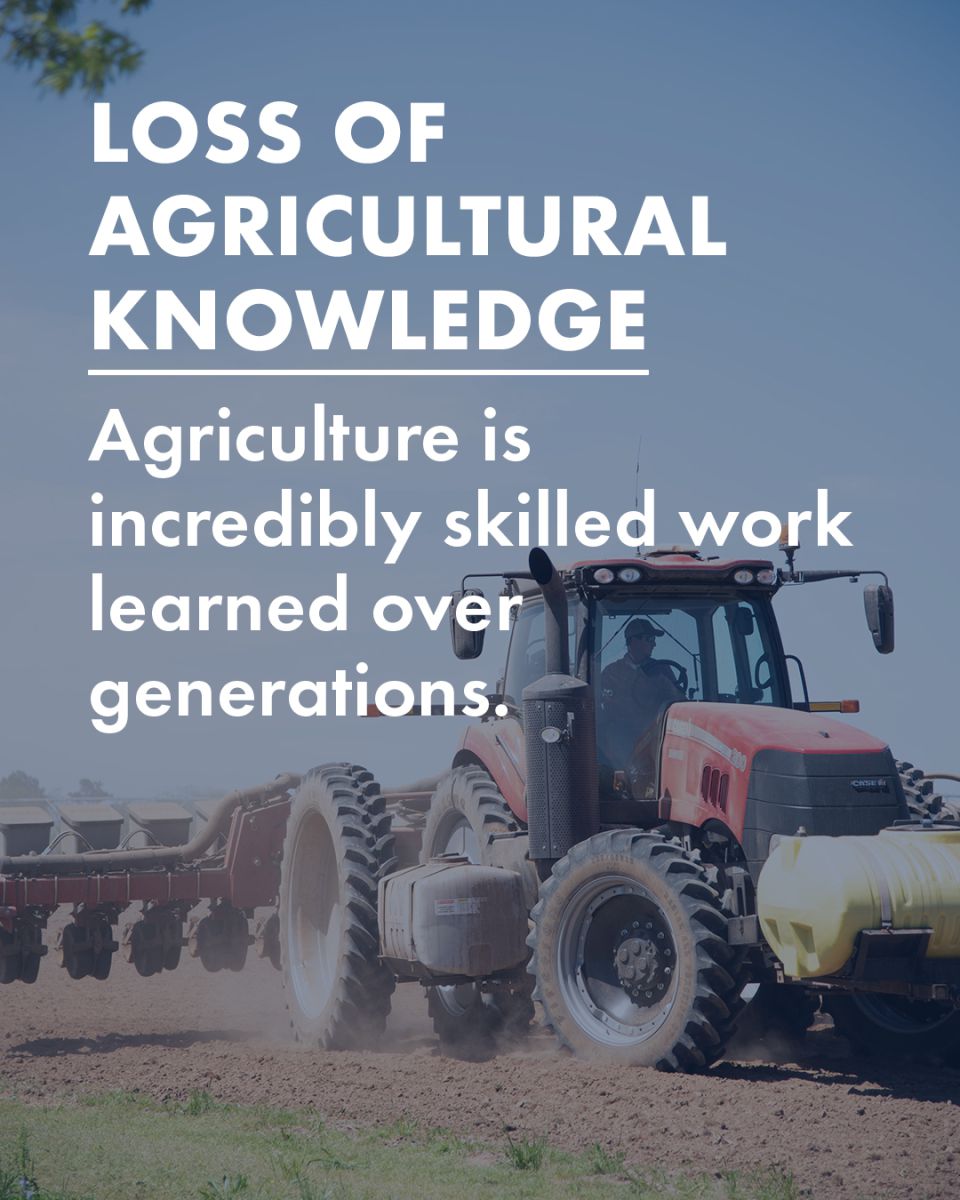
The number of family farms in America is shrinking, and that affects more than just those who work the land. Fewer farms mean less local food, higher prices, and increased reliance on imports. Rural communities weaken, and generations of agricultural knowledge are lost.
Learn more and help us share the facts: https://gfb.ag/strongfarms #StrongFarmsStrongGA
Caption Text to Copy and Paste - Option 2
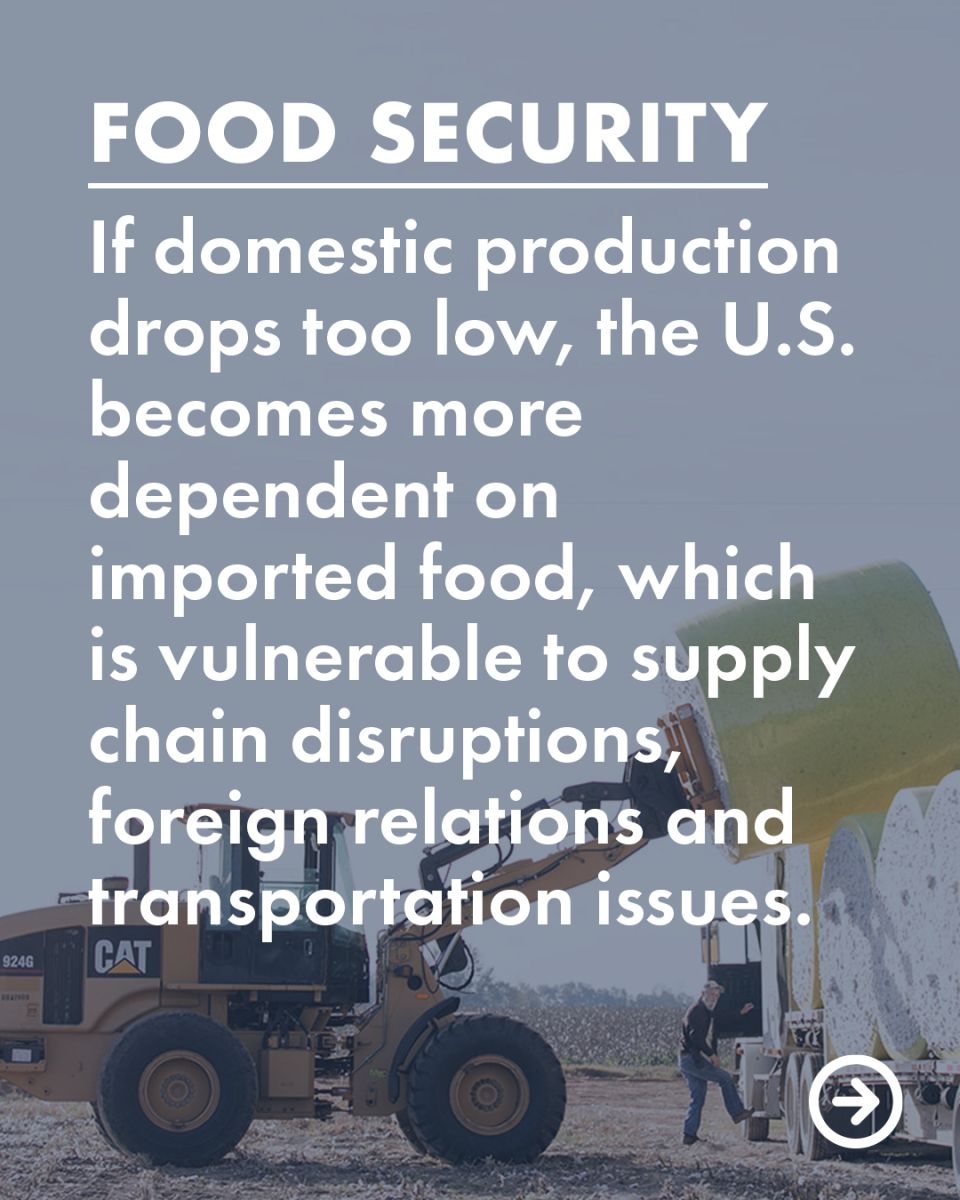
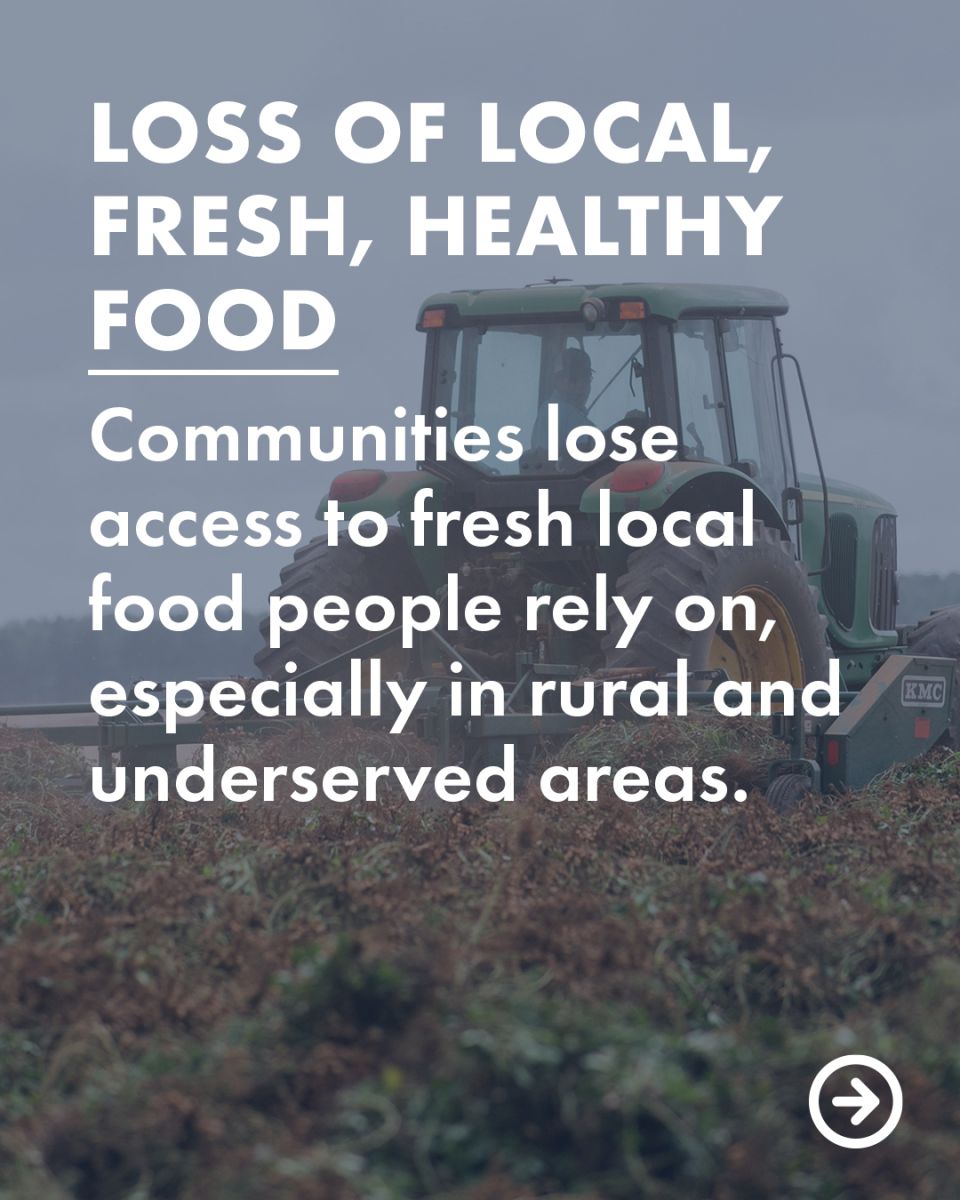
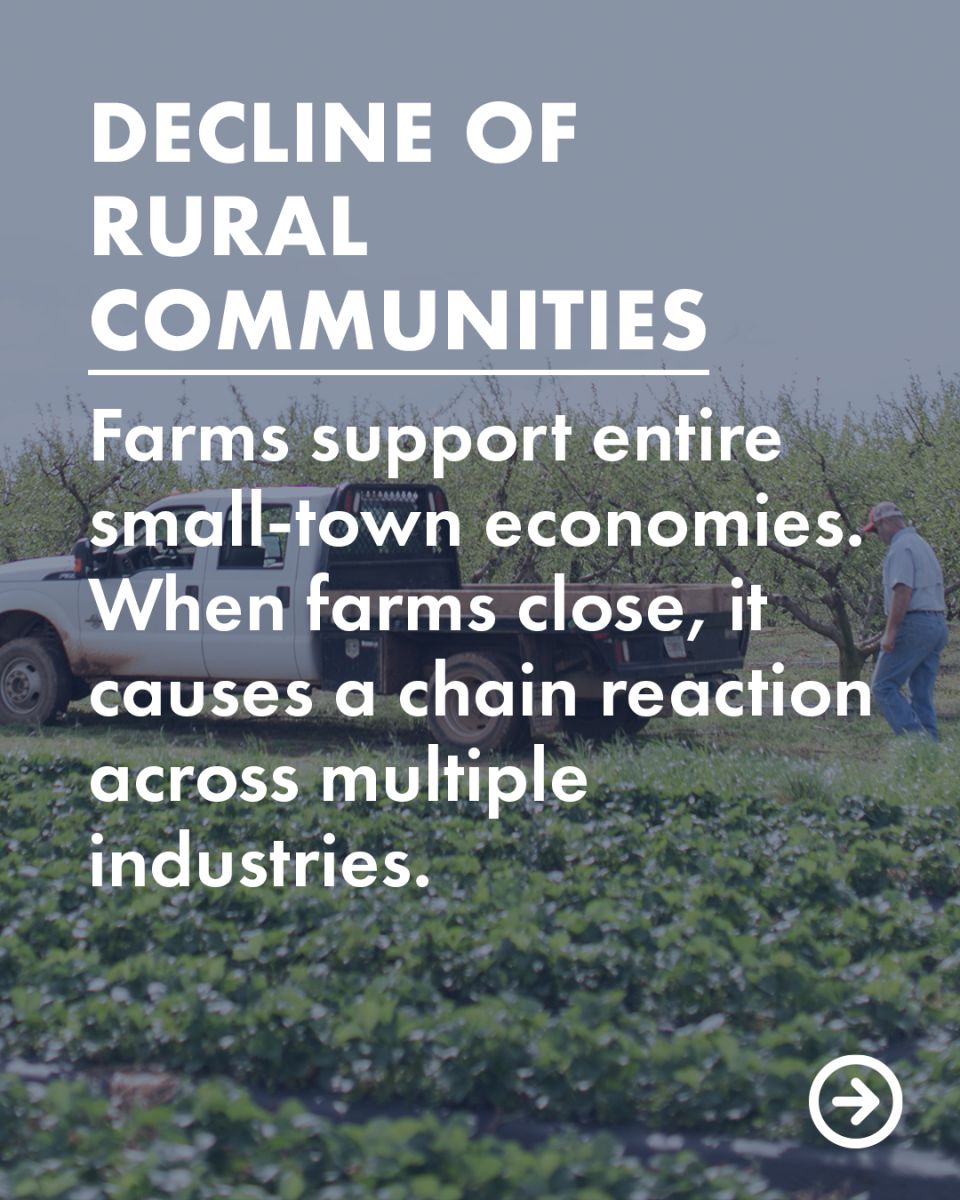
When farms go out of business, the impact reaches far beyond the farm gate. Communities lose access to fresh, local food. Rural economies feel the strain. Our domestic food system becomes more vulnerable.
Understanding why this is happening matters. Visit https://gfb.ag/strongfarms to learn more and help educate others. #StrongFarmsStrongGA
Caption Text to Copy and Paste - Option 3
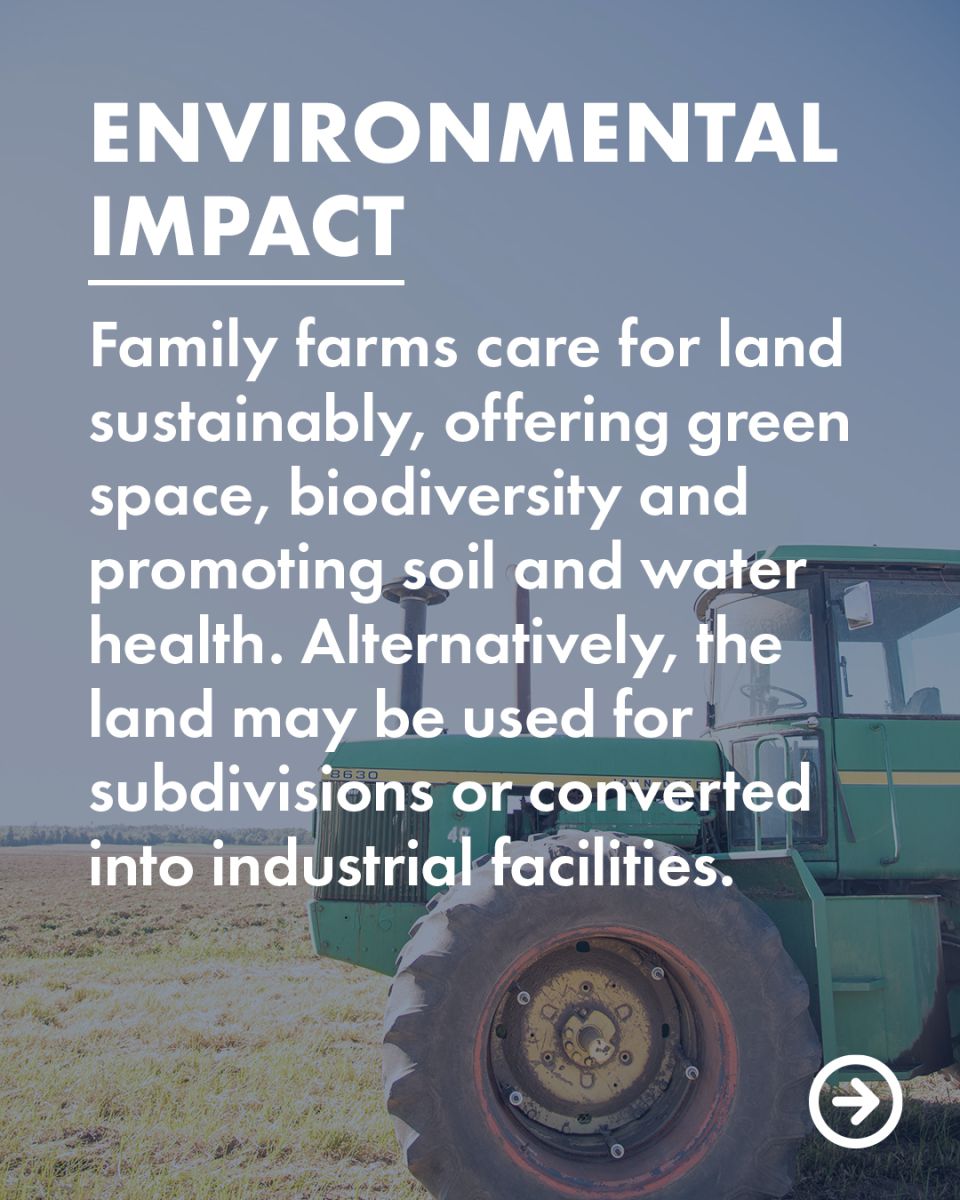
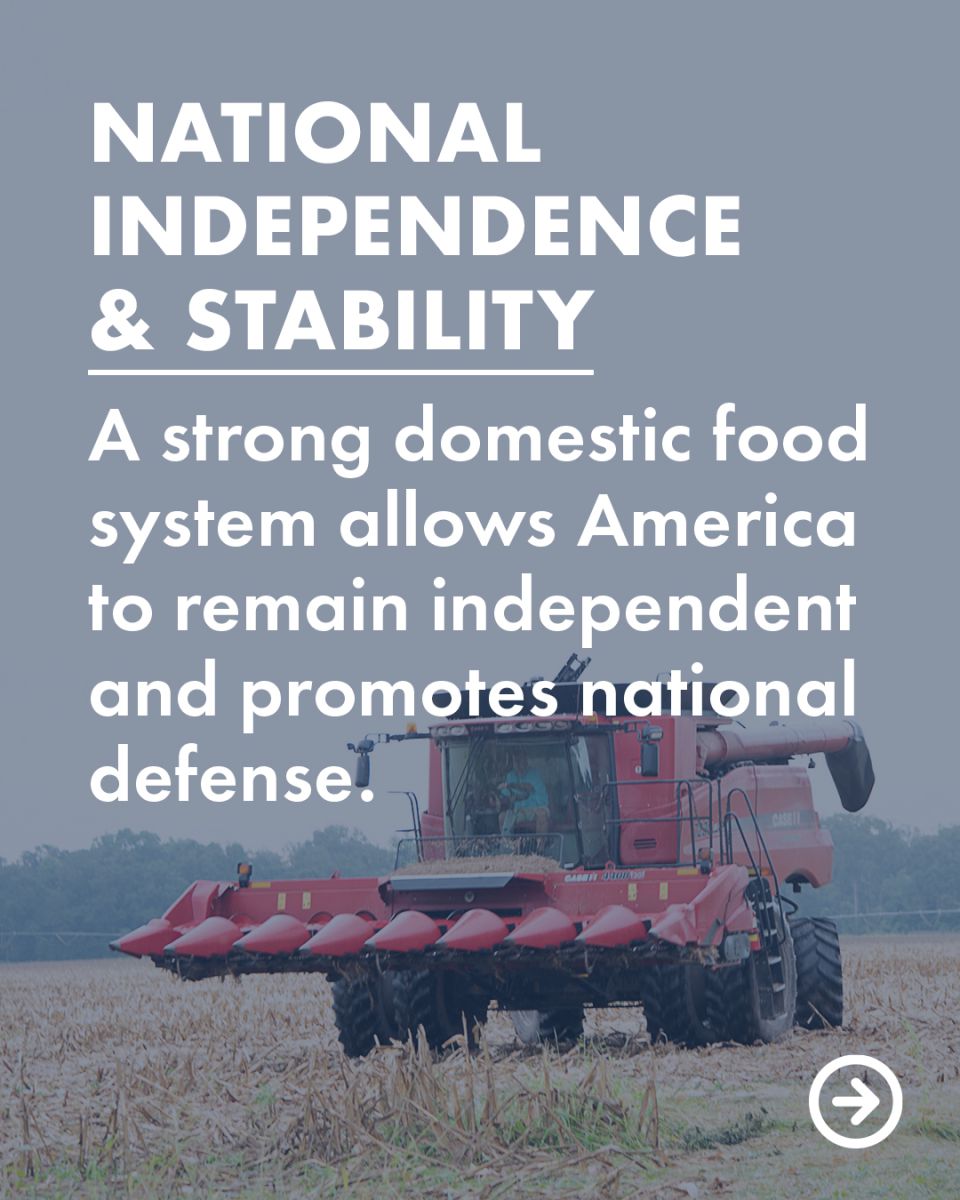
Family farms do more than grow food. They support local economies, protect open land, pass down generational knowledge and strengthen our national food security. As their numbers decline, those benefits decline with them.
Take time to understand the issue and help share the facts: https://gfb.ag/strongfarms #StrongFarmsStrongGA
Informational Carousel (Or Individual Posts): How Much Georgia Farmers Lost in 2025
The following graphics can be used all together in an educational carousel, or could be used individually to highlight specific commodities.
How to use it: Right click to download and save each of the images, then upload them to Instagram or Facebook. If you are using them as a carousel, make sure to upload them in order so it tells the story. Viewers will swipe left to get to the next slide. These can be used as posts or stories.
SLIDE 1: Intro
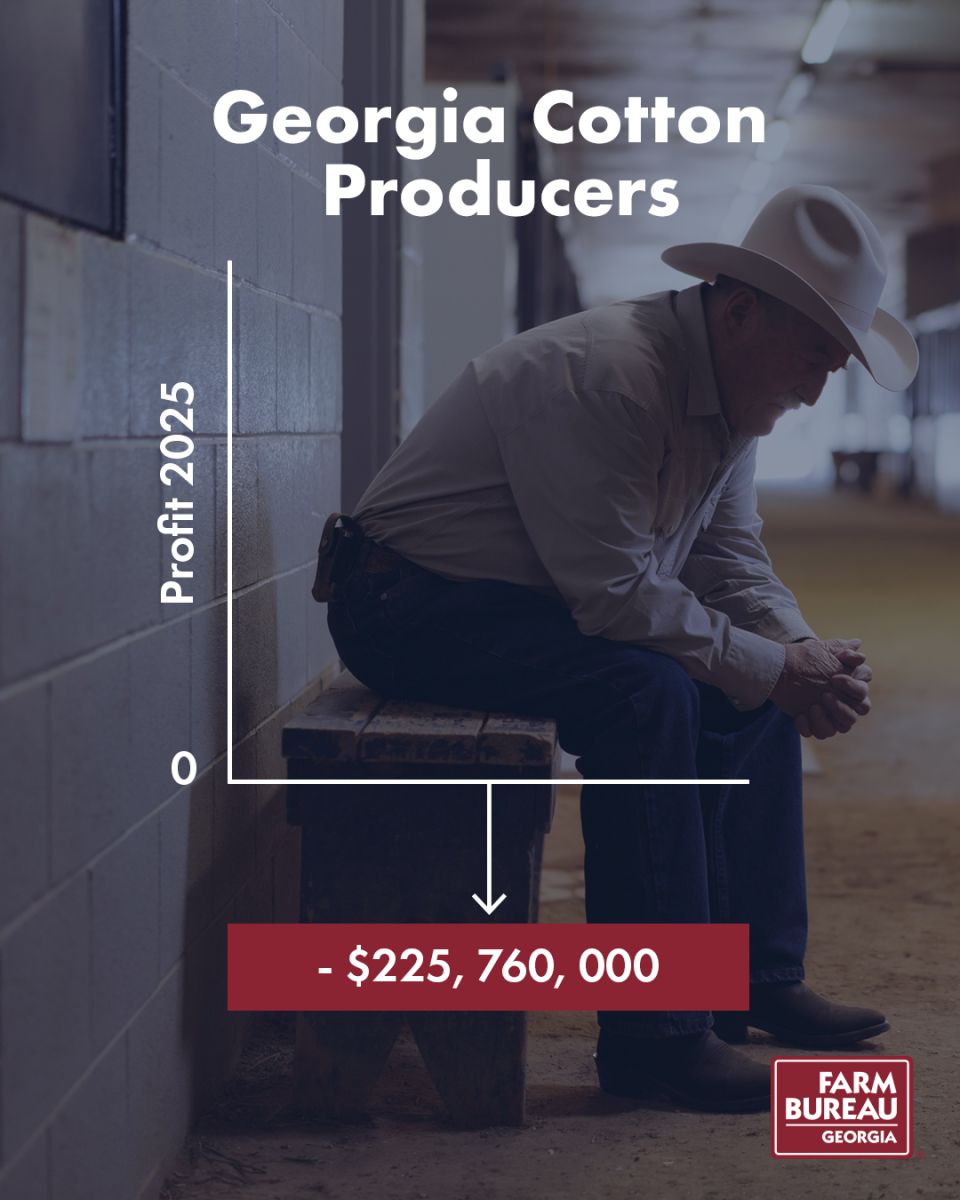
SLIDE 2: Cotton
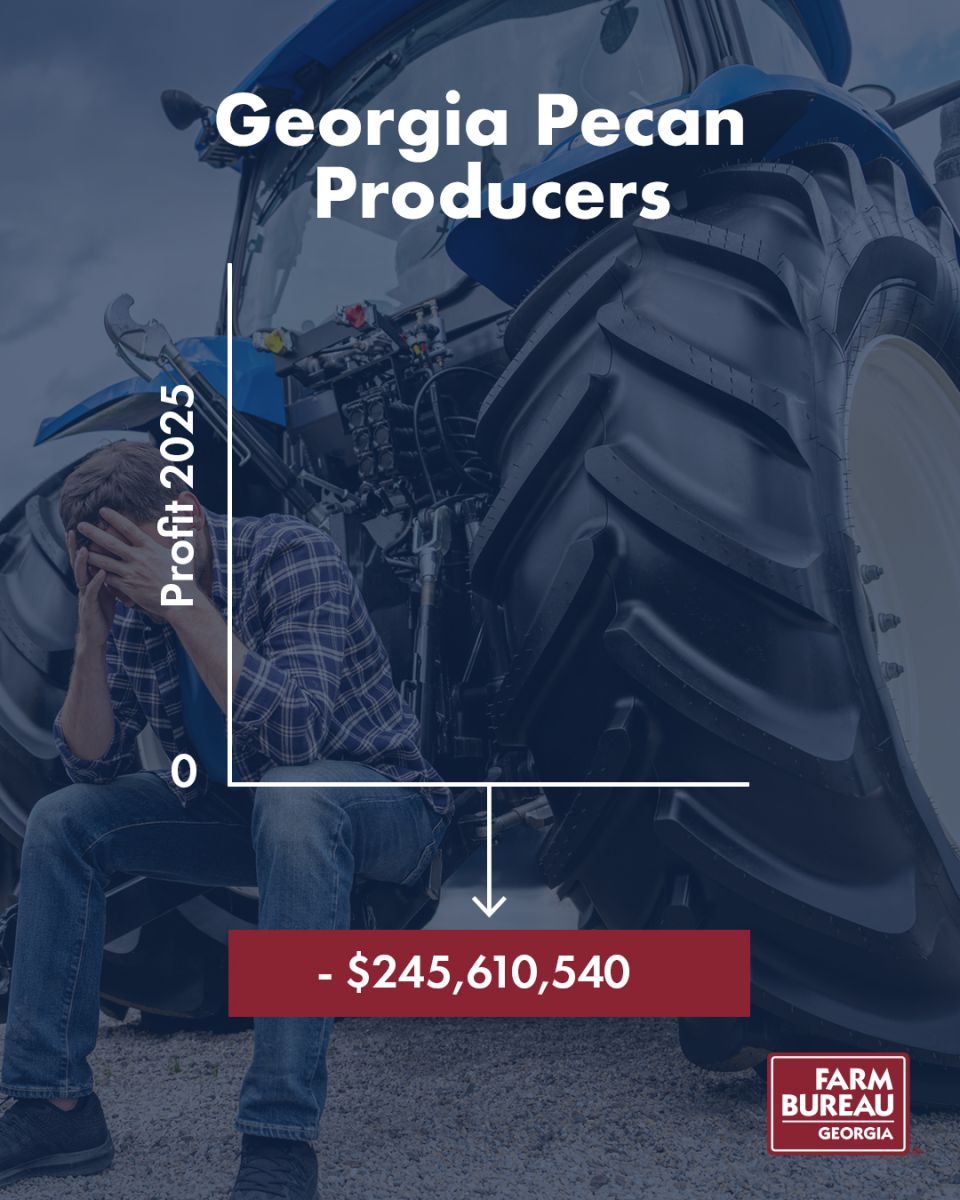
SLIDE 3: Pecans
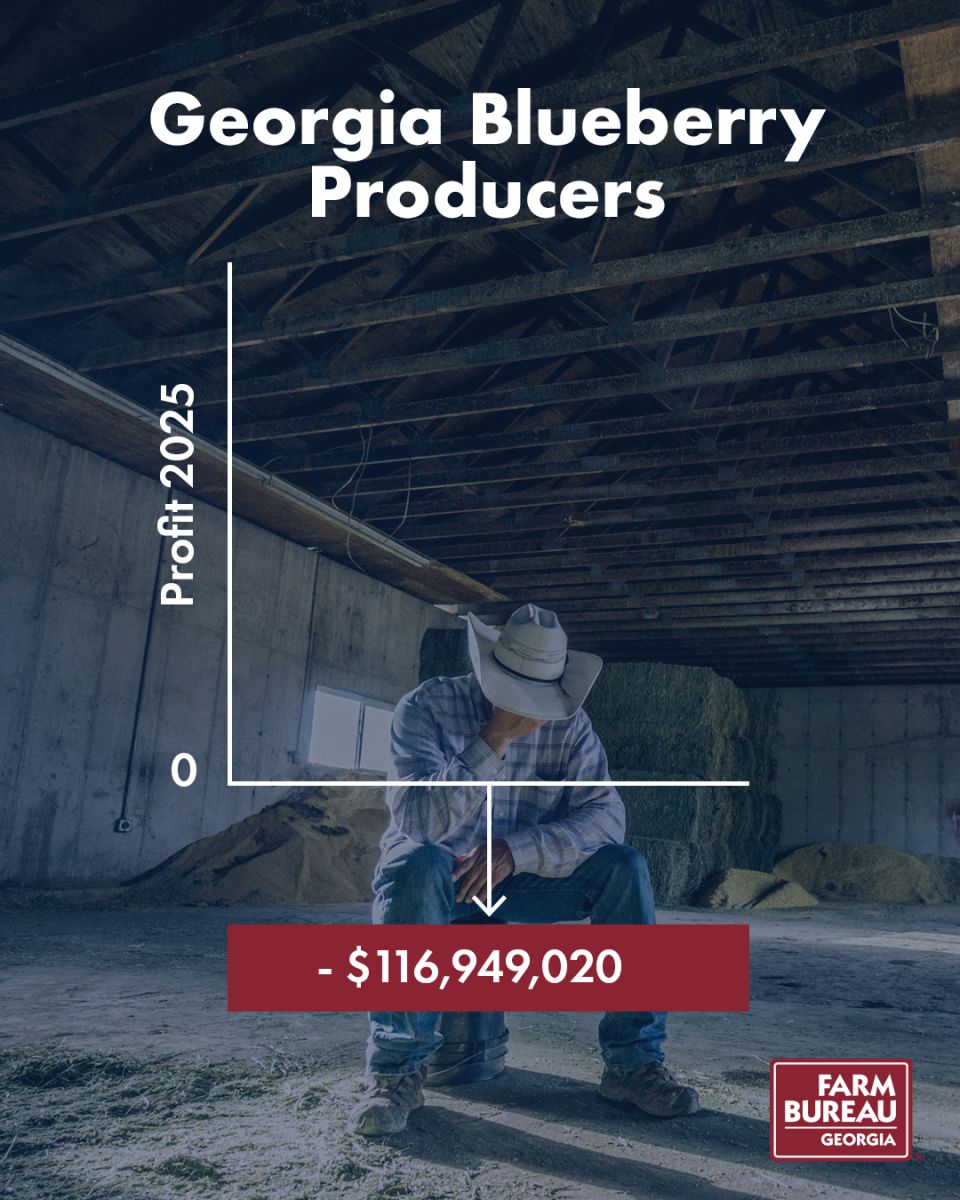
SLIDE 4: Blueberries
SLIDE 5:
Coming soon
SLIDE 6:
Coming soon
SLIDE 7:
Coming soon
SLIDE 8:
Coming soon
SLIDE 9:
Coming soon
SLIDE 10:
Coming soon
We encourage you to come up with your own captions to make it personal, but if you'd feel more comfortable having someone else come up with something, please copy and paste one of the caption options below:
Caption Text to Copy and Paste - Graphic: Georgia farmers lost nearly $800 million in 2025
In 2025, Georgia farmers lost nearly $800 million. These losses reflect the financial pressures facing farm families across our state as costs remain high and margins tighten.
Understanding these realities matters. Visit https://gfb.ag/strongfarms to learn more and help share the facts. #StrongFarmsStrongGA
Caption Text to Copy and Paste - Graphic: Georgia Pecan Producers
Georgia pecan producers experienced losses of more than $245 million in 2025. For one of our state’s signature crops, this represents a significant financial setback for growers and rural communities.
Learn what is contributing to these losses at https://gfb.ag/strongfarms #StrongFarmsStrongGA
Caption Text to Copy and Paste - Graphic: Georgia Cotton Producers
Georgia cotton producers lost more than $225 million in 2025. Cotton remains a cornerstone commodity for our state, and these losses highlight the challenges facing producers in today’s economic climate.
Get the full picture and help share the facts: https://gfb.ag/strongfarms #StrongFarmsStrongGA
Caption Text to Copy and Paste - Graphic: Georgia Blueberry Producers
Georgia blueberry producers faced nearly $117 million in losses in 2025. Even high-demand crops are not immune to rising costs and shifting market conditions.
Visit https://gfb.ag/strongfarms to better understand what Georgia farmers are navigating and help educate others. #StrongFarmsStrongGA
Informational Carousel: Why Is America Losing Family Farms? (Shorter)
This is a shorter version of the question of why farms are going out of business.
How to use it: Right click to download and save each of the images, then upload them to Instagram or Facebook. Make sure to upload them in order so it tells the story. Viewers will swipe left to get to the next slide. These can be used as posts or stories.
SLIDE 1:
SLIDE 2:
We encourage you to come up with your own captions to make it personal, but if you'd feel more comfortable having someone else come up with something, please copy and paste one of the caption options below:
Caption Text to Copy and Paste - Option 1
We are consuming more food than ever, yet farms are still going out of business. That disconnect raises an important question about the economic realities facing agriculture today. Understanding why this is happening is key to protecting the future of Georgia farming.
Learn more at https://gfb.ag/strongfarms #StrongFarmsStrongGA
Caption Text to Copy and Paste - Option 2
Farming today is more expensive, more regulated and more financially risky, often with little room for profit. While technology and production have advanced, margins have grown thinner, putting added strain on farm families across our state.
Visit https://gfb.ag/strongfarms to better understand the challenges facing Georgia agriculture. #StrongFarmsStrongGA
Issues Farmers are Facing
Georgia farmers find themselves at a crossroads of record high input costs and record low commodity prices for many of the products grown here in Georgia. Coupled with multiple years of severe natural disasters, the viability of many family farms is not promising. We urge policymakers to make it their top priority to address the needs of family farms across the state. For our state's # 1 industry to remain strong, we must focus our attention on the profitability of family farms.
Financial Sustainability of Georgia Farms is at Risk
-
Georgia farmers experienced about $800 million in profit loss in 2025.
-
Farm production costs have exceeded farm revenue 11 of the past 14 years.
-
$50 billion U.S. Ag Trade Deficit in 2025.
-
Tractor prices increased 21 % from 2020-2023 (Source: USDA, NASS)
-
Stagnant prices and increasing costs suggest a negative outlook for most of Georgia's major crops in 2026. (Source: University of Georgia College of Agriculture & Environmental Sciences "GA Ag lmpac/ Report")
.png)
.png)
.png)
These stressors are taken home, contributing to 42% of Georgia farmers having thoughts of suicide in the past year. (Source: Georgia Rural Health Innovation Center. /2022, June}. Farmers' concerns: A 9ualitative assessment to plan rural medical education. Georgia Rural Health)
AFBF survey shows Southern farmers hit hard by rising fuel & fertilizer costs
A nationwide American Farm Bureau Federation survey of farmers found that rising fertilizer and fuel costs are placing significant financial strain on agriculture, with 94% of respondents reporting their financial situation has worsened or stayed the same since 2025. Nearly 70% of farmers nationwide—and 78% in the South—say they cannot afford all the fertilizer they need, with Southern producers especially impacted. As a result, many farmers are reducing fertilizer use, cutting acreage, or switching crops—decisions that increase the risk of lower yields, reduced production, and continued financial pressure heading into the 2026 growing season.
Agricultural Lenders Echo These Concerns
-
Net farm income & working capital remain the top concerns of lenders the past decade, regardless of whether farm income levels were rising or falling.
-
Less than 45% of agricultural borrowers were profitable in 2025 with no expectation of improvement in 2026.
-
"Concerns continued to mount for grain and cotton producers beset by lower prices and elevated input costs."
Source: American Bankers Association & Farmer Mac. /2025, November 12). 2025 'Ag Lender Survey: Ag Lenders Signal Cautious Outlook for Farm Profitability'.
Support GA Farmers By:
-
Strengthening existing & incentivizing new domestic markets utilizing Ag commodities.
-
Investing in research to create advanced & innovative products from Ag commodities.
-
Creating a healthy business climate where farmers have access to resources that are reliable and affordable to continue farming.